emooki
HomePrice mapTransactions
🇬🇧 English🇫🇷 Français🇩🇪 Deutsch🇪🇸 Español🇮🇹 Italiano

Real estate price map


Real estate price map in the municipality of Saint-Nicolas-la-Chapelle, choose a section to see transactions by parcel.

Savoie (73)

Saint-Nicolas-la-Chapelle - Real estate price m²

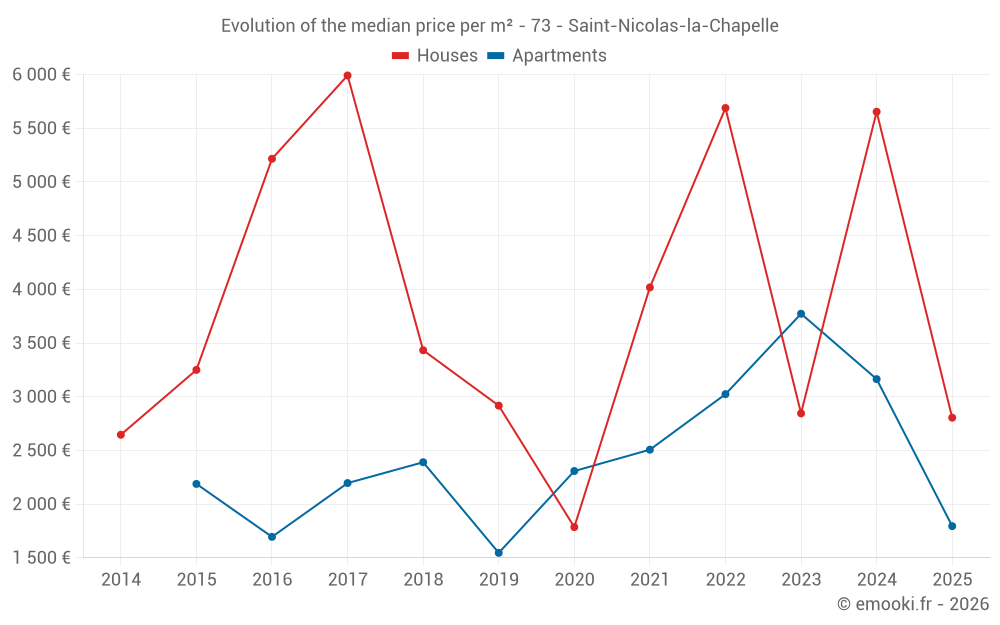
Median price of real estate
in the municipality of Saint-Nicolas-la-Chapelle

HousesHouses
3 852  /m²
1-23-45-67-89-10
Reliability 6/10
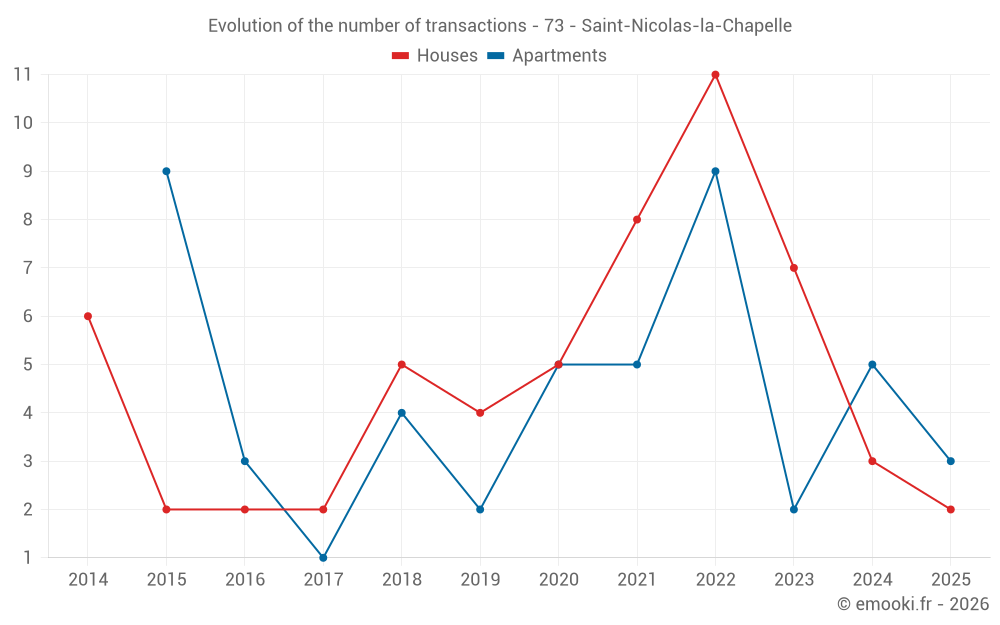
Median price on the 15 transactions of the last 36 months.
from 2 614 to
5 829  /m²
60% of transactions from the 2nd to the 8th deciles.
ApartmentsApartments
3 132  /m²
1-23-45-67-89-10
Reliability 6/10
Median price on the 17 transactions of the last 36 months.
from 2 359 to
3 958  /m²
60% of transactions from the 2nd to the 8th deciles.
DwellingsDwellings
3 728  /m²
1-23-45-67-89-10
Reliability 7/10
Median price on the 16 transactions of the last 24 months.
from 1 795 to
4 318  /m²
60% of transactions from the 2nd to the 8th deciles.

Yearly evolution

Evolution of the median price per m²

Evolution of the median price per m² - 73 - Saint-Nicolas-la-Chapelle

Evolution of the number of transactions

Warning, last year incomplete. Projections made based on the proportions between semesters of the previous year at the departmental/national level and by type of property.

Evolution of the number of transactions - 73 - Saint-Nicolas-la-Chapelle

Yearly data

Descending order
Year
Houses
house
transactions
Houses
house
Price per m²
Apartments
apt.
transactions
Apartments
apt.
Price per m²
2025
2
2 805 
3
1 795 
2024
3
5 654 
5
3 164 
2023
7
2 845 
2
3 773 
2022
11
5 689 
9
3 024 
2021
8
4 018 
5
2 507 
2020
5
1 786 
5
2 308 
2019
4
2 917 
2
1 546 
2018
5
3 433 
4
2 390 
2017
2
5 992 
1
2 196 
2016
2
5 216 
3
1 695 
2015
2
3 250 
9
2 188 
2014
6
2 646 
0
--- 

Analysis

Structure of prices per m²

Values of price percentiles per m² over the periods used for the estimated price of each type of property.

Structure of transaction amounts

Values of transaction amounts percentiles over the periods used for the estimated price of each type of property.

Transaction amounts and prices per m² by percentile

Ascending order
Percentile
Houses
house
Price per m²
Houses
house
Transaction amount
Apartments
apt.
Price per m²
Apartments
apt.
Transaction amount
10th percentile
1 710 
169 K
1 872 
59 681 
20th percentile
2 614 
195 K
2 359 
64 050 
30th percentile
2 921 
229 K
2 820 
67 730 
40th percentile
3 479 
312 K
3 052 
70 800 
50th percentile
3 852 
339 K
3 132 
72 040 
60th percentile
4 240 
469 K
3 408 
99 192 
70th percentile
5 167 
729 K
3 825 
112 K
80th percentile
5 829 
853 K
3 958 
140 K
90th percentile
6 886 
1 102 K
4 484 
344 K

National and departmental comparison

Evolution of the median price per m² of houses

Evolution of the median price per m² of apartments

Quarterly evolution

Evolution of the median price per m²

Evolution of the number of transactions

Quarterly data

Descending order
Quarter
Houses
house
transactions
Houses
house
Price per m²
Apartments
apt.
transactions
Apartments
apt.
Price per m²
2025 Q2
0
--- 
1
1 440 
2025 Q1
2
2 805 
2
3 056 
2024 Q4
0
--- 
3
3 808 
2024 Q3
2
5 087 
0
--- 
2024 Q2
0
--- 
2
2 252 
2024 Q1
1
5 654 
0
--- 
2023 Q4
2
2 634 
1
3 975 
2023 Q2
2
2 304 
1
3 571 
2023 Q1
3
3 226 
0
--- 
2022 Q4
1
5 290 
4
3 006 
2022 Q3
2
5 760 
3
3 095 
2022 Q2
5
8 289 
0
--- 
2022 Q1
3
5 689 
2
2 440 
2021 Q4
1
6 429 
0
--- 
2021 Q3
3
4 118 
2
2 539 
2021 Q2
2
3 659 
2
2 728 
2021 Q1
2
4 211 
1
2 292 
2020 Q4
1
700 
3
2 308 
2020 Q3
2
1 488 
1
2 667 
2020 Q2
1
1 786 
1
1 768 
2020 Q1
1
2 847 
0
--- 
2019 Q4
2
2 850 
0
--- 
2019 Q3
1
3 854 
0
--- 
2019 Q2
1
2 348 
2
1 546 
2018 Q4
1
2 939 
1
4 183 
2018 Q3
1
4 875 
3
2 342 
2018 Q2
1
3 433 
0
--- 
2018 Q1
2
3 798 
0
--- 
2017 Q3
1
2 983 
0
--- 
2017 Q1
1
9 000 
1
2 196 
2016 Q4
0
--- 
1
420 
2016 Q3
1
3 431 
2
2 089 
2016 Q2
1
7 000 
0
--- 
2015 Q4
1
2 070 
1
1 758 
2015 Q3
0
--- 
4
2 219 
2015 Q2
0
--- 
3
2 505 
2015 Q1
1
4 429 
1
1 891 
2014 Q3
3
2 688 
0
--- 
2014 Q2
1
4 625 
0
--- 
2014 Q1
2
1 866 
0
--- 

Overview of the latest real estate transactions

The following list is an anonymized overview of the latest transactions. For more details and to find all transactions, please use the map to view transactions by plot or the transaction search page for a search by criteria.

2025-06-17
2 500 
Sale
Land
1055 m2
-Futaies mixtes
Land
1365 m2
-Futaies mixtes
Land
95 m2
-Prés
Land
1500 m2
-Prés
Land
815 m2
-Futaies mixtes
2025-06-12
72 000 
1 440  /m²(50 m²)
Sale
Apartments
Apartment
2 rooms
50 m2
2 outbuildings
2025-03-07
869 000 
3 950  /m²(220 m²)
Sale
Houses
House
5 rooms
110 m2
Houses
House
5 rooms
110 m2
Land
500 m2
-Sols
Land
2095 m2
-Prés
Land
1550 m2
-Prés
Land
500 m2
-Sols
2025-01-22
174 300 
1 660  /m²(105 m²)
Sale
Houses
House
5 rooms
105 m2
Land
1002 m2
-Sols
2025-01-21
70 000 
1 795  /m²(39 m²)
Sale
Apartments
Apartment
1 room
39 m2
2025-01-14
99 320 
4 318  /m²(23 m²)
Sale
Apartments
Apartment
1 room
23 m2
3 outbuildings
2024-11-26
99 000 
3 808  /m²(26 m²)
Sale
Apartments
Apartment
1 room
26 m2
2 outbuildings
2024-10-24
428 000 
3 891  /m²(110 m²)
Sale
Apartments
Apartment
4 rooms
68 m2
Apartments
Apartment
2 rooms
42 m2
1 outbuilding
Land
846 m2
-Sols
Land
222 m2
-Prés
2024-10-18
287 950 
3 164  /m²(91 m²)
Sale
Apartments
Apartment
4 rooms
91 m2
2024-10-08
1 740 
Sale
Land
2460 m2
-Prés
Land
23 m2
-Sols
Land
3 m2
-Sols
2024-10-01
1 051 
Sale
Land
65 m2
-Sols
Land
3 m2
-Prés
Land
1031 m2
-Sols
Land
100 m2
-Sols
Land
13 m2
-Prés
Land
290 m2
-Sols
Land
416 m2
-Sols
Land
90 m2
-Sols
Land
13 m2
-Sols
2024-09-18
848 500 
6 527  /m²(130 m²)
Sale
Houses
House
4 rooms
130 m2
Land
279 m2
-Prés
Land
1000 m2
-Sols
2024-08-20
2 500 
Sale
Land
2393 m2
-Futaies mixtes
2024-08-01
448 520 
3 647  /m²(123 m²)
Sale
Houses
House
4 rooms
123 m2
1 outbuilding
Land
335 m2
-Sols
Land
100 m2
-Prés
Land
475 m2
-Prés
Land
900 m2
-Prés
Land
32 m2
-Sols
2024-07-12
90 238 
Sale
Land
1708 m2
-Terres
2024-06-27
110 000 
Sale
Land
640 m2
-Prés
2024-05-06
59 380 
2 582  /m²(23 m²)
Sale
Apartments
Apartment
1 room
23 m2
2 outbuildings
2024-04-19
50 000 
1 923  /m²(26 m²)
Sale
Apartments
Apartment
1 room
26 m2
2 outbuildings
2024-04-12
100 
Exchange
Land
1720 m2
-Sols
Land
1 m2
-Sols
Land
17 m2
-Sols
Land
54 m2
-Sols
Land
59 m2
-Sols
Land
5 m2
-Sols
2024-04-09
3 600 
Sale
Land
18 m2
-Futaies mixtes
Land
1748 m2
-Futaies mixtes
Land
2174 m2
-Prés
210 transactions listed in the municipality

Savoie (73)

Most expensive cities

City
name
Descending orderHouses
house
Price per m²
41 730 
15 064 
9 926 
8 106 
7 708 
7 667 
7 570 
6 752 
6 184 
City
name
Descending orderApartments
apt.
Price per m²
12 707 
12 414 
10 959 
10 302 
8 611 
6 667 
6 146 
6 116 
5 770 

Least expensive cities

City
name
Ascending orderHouses
house
Price per m²
1 250 
1 316 
1 333 
1 344 
1 354 
1 384 
1 500 
City
name
Ascending orderApartments
apt.
Price per m²
400 
520 
528 
672 
797