emooki
HomePrice mapTransactions
🇬🇧 English🇫🇷 Français🇩🇪 Deutsch🇪🇸 Español🇮🇹 Italiano

Real estate price map


Real estate price map in the municipality of Saint-Béron, choose a section to see transactions by parcel.

Savoie (73)
Saint-Béron

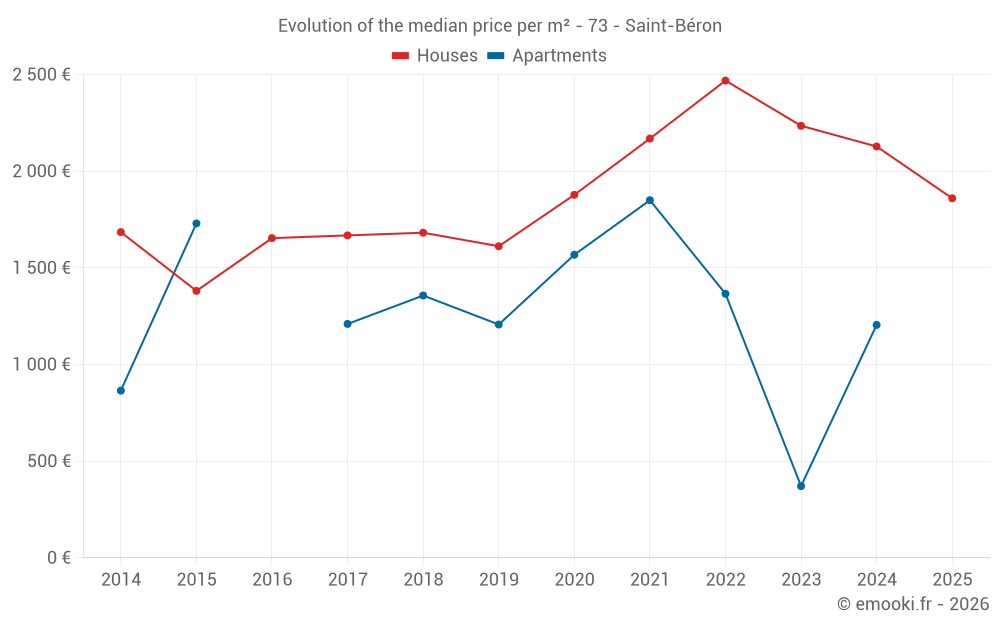
Median price of real estate
in the municipality of Saint-Béron

HousesHouses
2 124  /m²
1-23-45-67-89-10
Reliability 7/10
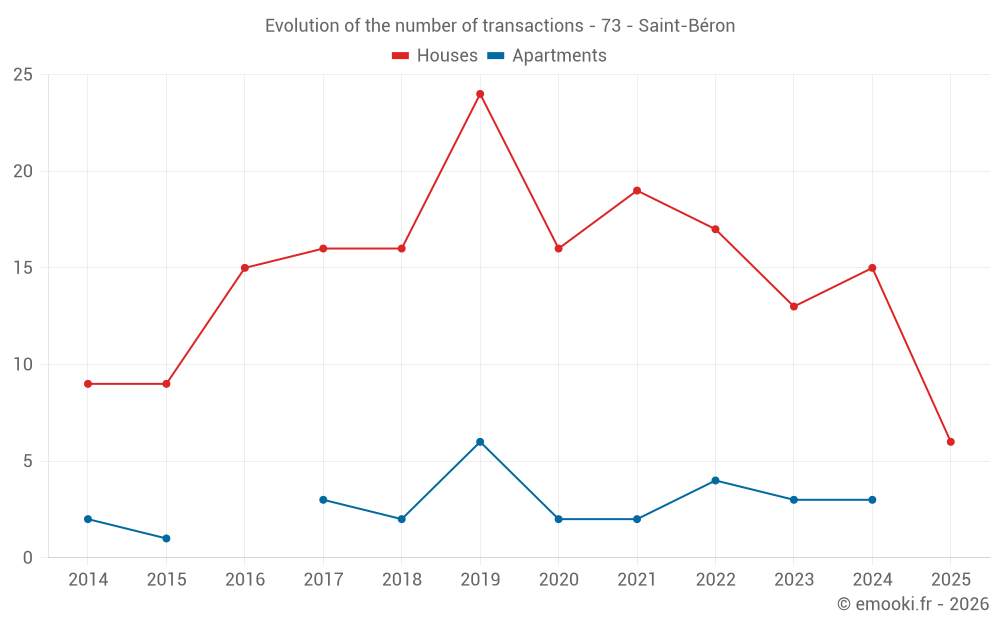
Median price on the 28 transactions of the last 24 months.
from 1 655 to
2 680  /m²
60% of transactions from the 2nd to the 8th deciles.
ApartmentsApartments
1 282  /m²
1-23-45-67-89-10
Reliability 5/10
Median price on the 12 transactions of the last 48 months.
from 598 to
1 552  /m²
60% of transactions from the 2nd to the 8th deciles.
DwellingsDwellings
1 897  /m²
1-23-45-67-89-10
Reliability 8/10
Median price on the 17 transactions of the last 12 months.
from 1 525 to
2 614  /m²
60% of transactions from the 2nd to the 8th deciles.
HousesEvolution of the price per m² of houses since...
1 year
-13%
2 years
-17%
3 years
-25%
4 years
-14%
5 years
-1%
6 years
+15%
7 years
+11%
8 years
+12%
9 years
+12%
10 years
+35%
11 years
+10%
The price per m² of houses has decreased by 25% since 3 years, but it has increased by 35% in 10 years.

Yearly evolution

Evolution of the median price per m²

Evolution of the number of transactions

Warning, last year incomplete. Projections made based on the proportions between semesters of the previous year at the departmental/national level and by type of property.

Yearly data

Descending order
Year
Houses
house
transactions
Houses
house
Price per m²
Apartments
apt.
transactions
Apartments
apt.
Price per m²
2025
6
1 860 
0
--- 
2024
15
2 128 
3
1 205 
2023
13
2 235 
3
371 
2022
17
2 469 
4
1 366 
2021
19
2 169 
2
1 850 
2020
16
1 878 
2
1 568 
2019
24
1 612 
6
1 207 
2018
16
1 682 
2
1 357 
2017
16
1 668 
3
1 210 
2016
15
1 654 
0
--- 
2015
9
1 381 
1
1 730 
2014
9
1 685 
2
865 

Analysis

Structure of prices per m²

Values of price percentiles per m² over the periods used for the estimated price of each type of property.

Structure of transaction amounts

Values of transaction amounts percentiles over the periods used for the estimated price of each type of property.

Transaction amounts and prices per m² by percentile

Ascending order
Percentile
Houses
house
Price per m²
Houses
house
Transaction amount
Apartments
apt.
Price per m²
Apartments
apt.
Transaction amount
10th percentile
1 479 
149 K
385 
25 100 
20th percentile
1 655 
170 K
598 
28 800 
30th percentile
1 812 
192 K
1 001 
47 500 
40th percentile
1 907 
218 K
1 155 
69 400 
50th percentile
2 124 
249 K
1 282 
87 000 
60th percentile
2 265 
287 K
1 368 
135 K
70th percentile
2 552 
301 K
1 413 
175 K
80th percentile
2 680 
308 K
1 552 
188 K
90th percentile
2 991 
353 K
1 605 
217 K

National and departmental comparison

Evolution of the median price per m² of houses

Evolution of the median price per m² of apartments

Quarterly evolution

Evolution of the median price per m²

Evolution of the number of transactions

Quarterly data

Descending order
Quarter
Houses
house
transactions
Houses
house
Price per m²
Apartments
apt.
transactions
Apartments
apt.
Price per m²
2025 Q2
2
1 786 
0
--- 
2025 Q1
4
1 860 
0
--- 
2024 Q4
6
2 024 
1
510 
2024 Q3
3
1 816 
1
1 429 
2024 Q2
3
2 359 
0
--- 
2024 Q1
3
2 241 
1
1 205 
2023 Q4
4
2 342 
0
--- 
2023 Q3
3
2 202 
0
--- 
2023 Q2
4
2 298 
2
552 
2023 Q1
2
2 764 
1
371 
2022 Q4
5
3 113 
1
1 358 
2022 Q3
4
2 419 
0
--- 
2022 Q2
2
2 267 
2
1 248 
2022 Q1
6
2 419 
1
1 607 
2021 Q4
5
2 120 
0
--- 
2021 Q3
9
2 169 
2
1 850 
2021 Q2
1
2 354 
0
--- 
2021 Q1
4
2 289 
0
--- 
2020 Q4
5
2 162 
0
--- 
2020 Q3
5
1 948 
0
--- 
2020 Q2
4
1 405 
0
--- 
2020 Q1
2
1 406 
2
1 568 
2019 Q4
5
1 796 
2
1 367 
2019 Q3
6
1 314 
2
1 340 
2019 Q2
6
1 666 
1
1 198 
2019 Q1
7
1 740 
1
1 216 
2018 Q4
5
1 871 
1
1 350 
2018 Q3
4
1 608 
0
--- 
2018 Q2
4
1 526 
0
--- 
2018 Q1
3
1 681 
1
1 364 
2017 Q4
5
1 964 
0
--- 
2017 Q3
3
1 358 
0
--- 
2017 Q2
5
1 695 
3
1 210 
2017 Q1
3
1 767 
0
--- 
2016 Q4
3
1 563 
0
--- 
2016 Q3
4
1 622 
0
--- 
2016 Q2
3
1 986 
0
--- 
2016 Q1
5
1 868 
0
--- 
2015 Q4
3
1 286 
1
1 730 
2015 Q3
3
1 381 
0
--- 
2015 Q2
2
1 548 
0
--- 
2015 Q1
1
1 066 
0
--- 
2014 Q4
2
1 998 
0
--- 
2014 Q3
5
1 526 
1
1 069 
2014 Q2
0
--- 
1
661 
2014 Q1
2
1 522 
0
--- 

Overview of the latest real estate transactions

The following list is an anonymized overview of the latest transactions. For more details and to find all transactions, please use the map to view transactions by plot or the transaction search page for a search by criteria.

2025-06-13
340 000 
2 698  /m²(126 m²)
Sale
Houses
House
4 rooms
126 m2
Land
500 m2
-Sols
Land
970 m2
-Prés
Land
1317 m2
-Terres
2025-05-28
400 
Sale
Land
4555 m2
-Taillis simples
2025-05-20
440 000 
2 558  /m²(172 m²)
3 143  /m²(140 m²)
Sale
Houses
House
5 rooms
140 m2
Commercial property
32 m2
1 outbuilding
Land
839 m2
-Sols
Land
418 m2
-Taillis simples
Land
17510 m2
-Prés
Land
112 m2
-Sols
Land
55 m2
-Sols
2025-04-17
54 
Sale
Land
54 m2
-Sols
2025-04-16
70 000 
875  /m²(80 m²)
Sale
Houses
House
2 rooms
40 m2
Houses
House
2 rooms
40 m2
Land
886 m2
-Sols
2025-03-28
214 825 
2 652  /m²(81 m²)
Sale
Houses
House
4 rooms
81 m2
Land
536 m2
-Sols
2025-03-10
320 410 
1 643  /m²(195 m²)
Sale
Houses
House
8 rooms
195 m2
Land
657 m2
-Sols
Land
343 m2
-Terrains à bâtir
2025-03-07
264 400 
1 811  /m²(146 m²)
Sale
Houses
House
7 rooms
146 m2
Land
300 m2
-Jardins
Land
282 m2
-Sols
Land
16 m2
-Sols
Land
109 m2
-Sols
2025-03-05
382 000 
1 910  /m²(200 m²)
Sale
Houses
House
5 rooms
200 m2
Land
1166 m2
-Sols
2025-02-26
60 000 
Sale
Land
1000 m2
-Prés
2025-02-06
2 251 
Sale
Land
4385 m2
-Taillis simples
Land
2470 m2
-Taillis simples
Land
2240 m2
-Taillis simples
Land
910 m2
-Futaies mixtes
Land
2380 m2
-Taillis simples
Land
2380 m2
-Futaies mixtes
2024-12-30
300 500 
2 463  /m²(122 m²)
Sale
Houses
House
4 rooms
122 m2
1 outbuilding
Land
988 m2
-Prés
Land
500 m2
-Sols
2024-12-19
59 000 
Sale
Land
503 m2
-Sols
2024-12-19
161 300 
1 920  /m²(84 m²)
Sale
Houses
House
2 rooms
42 m2
Houses
House
2 rooms
42 m2
Land
250 m2
-Prés
Land
1000 m2
-Prés
Land
182 m2
-Sols
Land
1066 m2
-Prés
Land
266 m2
-Prés
2024-12-06
110 000 
2 973  /m²(37 m²)
Sale
Houses
House
2 rooms
37 m2
Land
440 m2
-Sols
2024-11-27
200 000 
2 128  /m²(94 m²)
Sale
Houses
House
5 rooms
94 m2
Land
772 m2
-Sols
2024-11-27
301 550 
1 675  /m²(180 m²)
Sale
Houses
House
4 rooms
180 m2
1 outbuilding
Land
649 m2
-Prés
Land
459 m2
-Sols
2024-11-21
270 000 
2 755  /m²(98 m²)
3 462  /m²(78 m²)
Sale
Houses
House
3 rooms
78 m2
Commercial property
20 m2
Land
500 m2
-Sols
Land
1495 m2
-Prés
2024-11-08
25 000 
510  /m²(49 m²)
Sale
Apartments
Apartment
2 rooms
49 m2
2024-11-04
239 000 
1 897  /m²(126 m²)
Sale
Houses
House
4 rooms
126 m2
Land
397 m2
-Sols
Land
2103 m2
-Prés
Land
175 m2
-Sols
397 transactions listed in the municipality

Savoie (73)

Most expensive cities

City
name
Descending orderHouses
house
Price per m²
41 730 
15 064 
9 926 
8 106 
7 708 
7 667 
7 570 
6 752 
6 184 
City
name
Descending orderApartments
apt.
Price per m²
12 707 
12 414 
10 959 
10 302 
8 611 
6 667 
6 146 
6 116 
5 770 

Least expensive cities

City
name
Ascending orderHouses
house
Price per m²
1 250 
1 316 
1 333 
1 344 
1 354 
1 384 
1 500 
City
name
Ascending orderApartments
apt.
Price per m²
400 
520 
528 
672 
797