emooki
HomePrice mapTransactions
🇬🇧 English🇫🇷 Français🇩🇪 Deutsch🇪🇸 Español🇮🇹 Italiano

Real estate price map


Real estate price map in the municipality of Valgelon-La Rochette, choose a section to see transactions by parcel.

Savoie (73)

Valgelon-La Rochette - Real estate price m²

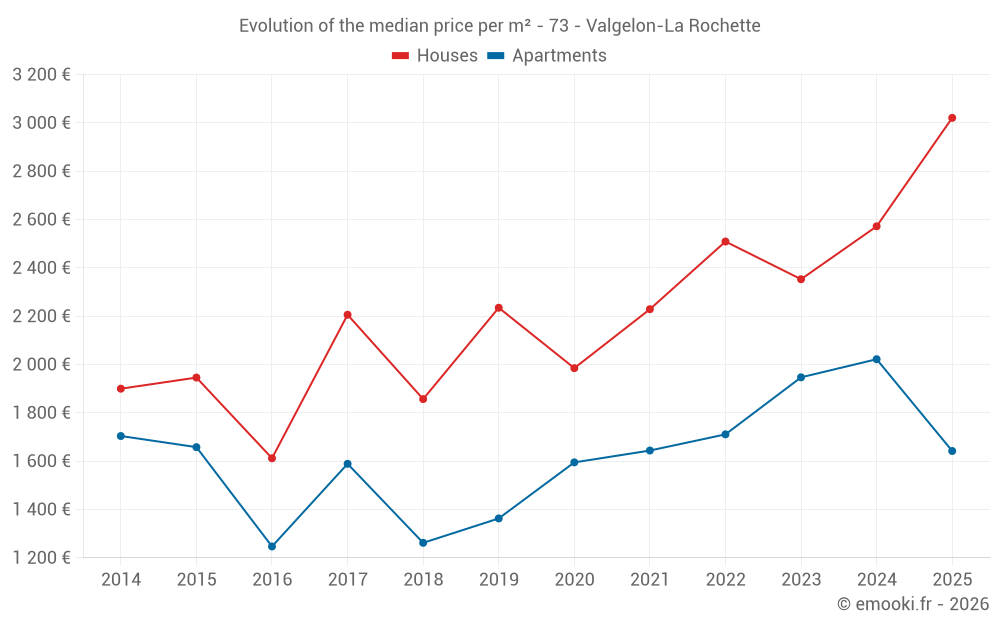
Median price of real estate
in the municipality of Valgelon-La Rochette

HousesHouses
2 766  /m²
1-23-45-67-89-10
Reliability 8/10
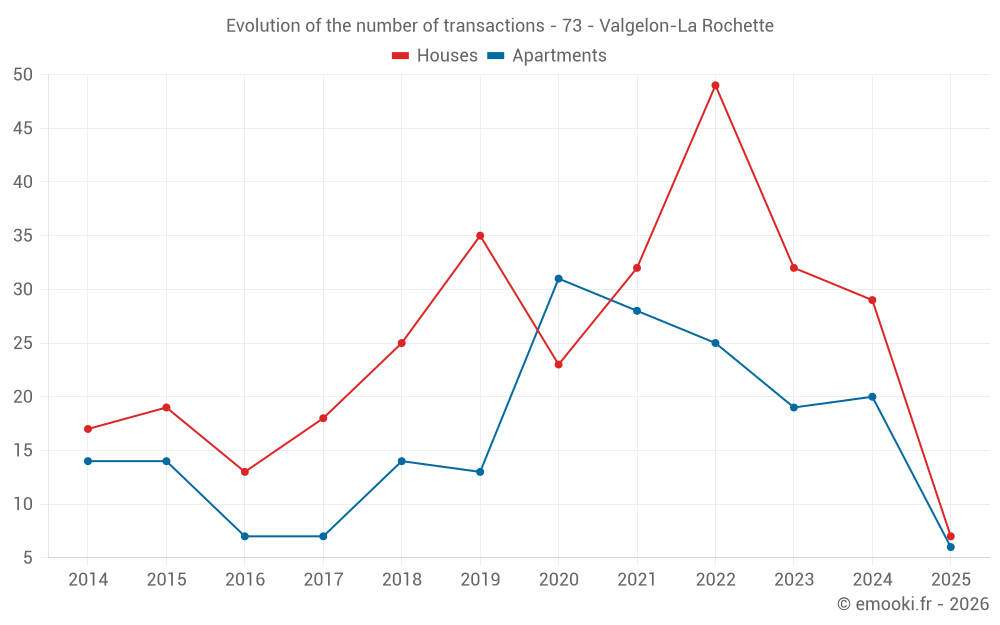
Median price on the 24 transactions of the last 12 months.
from 2 039 to
3 486  /m²
60% of transactions from the 2nd to the 8th deciles.
ApartmentsApartments
1 864  /m²
1-23-45-67-89-10
Reliability 8/10
Median price on the 21 transactions of the last 12 months.
from 1 324 to
2 215  /m²
60% of transactions from the 2nd to the 8th deciles.
DwellingsDwellings
2 160  /m²
1-23-45-67-89-10
Reliability 8/10
Median price on the 45 transactions of the last 12 months.
from 1 721 to
3 069  /m²
60% of transactions from the 2nd to the 8th deciles.
HousesEvolution of the price per m² of houses since...
1 year
+17%
2 years
+28%
3 years
+20%
4 years
+36%
5 years
+52%
6 years
+35%
7 years
+63%
8 years
+37%
9 years
+87%
10 years
+55%
11 years
+59%
ApartmentsEvolution of the price per m² of apartments since...
1 year
-19%
2 years
-16%
3 years
-4%
4 years
-0.1%
5 years
+2.9%
6 years
+20%
7 years
+30%
8 years
+3.3%
9 years
+32%
10 years
-1%
11 years
-3.6%
The price per m² of apartments has decreased by 19% since 1 year, but it has increased by 32% in 9 years.

Yearly evolution

Evolution of the median price per m²

Evolution of the median price per m² - 73 - Valgelon-La Rochette

Evolution of the number of transactions

Warning, last year incomplete. Projections made based on the proportions between semesters of the previous year at the departmental/national level and by type of property.

Evolution of the number of transactions - 73 - Valgelon-La Rochette

Yearly data

Descending order
Year
Houses
house
transactions
Houses
house
Price per m²
Apartments
apt.
transactions
Apartments
apt.
Price per m²
2025
7
3 021 
6
1 642 
2024
29
2 572 
20
2 022 
2023
32
2 353 
19
1 947 
2022
49
2 509 
25
1 711 
2021
32
2 229 
28
1 644 
2020
23
1 985 
31
1 595 
2019
35
2 235 
13
1 363 
2018
25
1 857 
14
1 262 
2017
18
2 206 
7
1 589 
2016
13
1 612 
7
1 247 
2015
19
1 946 
14
1 658 
2014
17
1 900 
14
1 704 

Analysis

Structure of prices per m²

Values of price percentiles per m² over the periods used for the estimated price of each type of property.

Structure of transaction amounts

Values of transaction amounts percentiles over the periods used for the estimated price of each type of property.

Transaction amounts and prices per m² by percentile

Ascending order
Percentile
Houses
house
Price per m²
Houses
house
Transaction amount
Apartments
apt.
Price per m²
Apartments
apt.
Transaction amount
10th percentile
1 770 
145 K
934 
71 000 
20th percentile
2 039 
208 K
1 324 
81 610 
30th percentile
2 484 
226 K
1 675 
113 K
40th percentile
2 594 
261 K
1 816 
125 K
50th percentile
2 766 
269 K
1 864 
129 K
60th percentile
3 017 
277 K
1 869 
142 K
70th percentile
3 356 
291 K
2 053 
177 K
80th percentile
3 486 
322 K
2 215 
195 K
90th percentile
3 738 
400 K
2 657 
227 K

National and departmental comparison

Evolution of the median price per m² of houses

Evolution of the median price per m² of apartments

Quarterly evolution

Evolution of the median price per m²

Evolution of the number of transactions

Quarterly data

Descending order
Quarter
Houses
house
transactions
Houses
house
Price per m²
Apartments
apt.
transactions
Apartments
apt.
Price per m²
2025 Q2
4
2 851 
3
1 450 
2025 Q1
3
3 087 
3
1 864 
2024 Q4
8
3 176 
11
1 869 
2024 Q3
9
2 572 
4
2 226 
2024 Q2
3
3 432 
1
2 111 
2024 Q1
9
2 067 
4
2 254 
2023 Q4
6
2 498 
4
2 039 
2023 Q3
11
2 331 
5
2 319 
2023 Q2
7
2 830 
6
1 864 
2023 Q1
8
2 096 
4
1 806 
2022 Q4
13
2 827 
6
1 888 
2022 Q3
11
2 729 
7
1 624 
2022 Q2
13
2 400 
6
2 101 
2022 Q1
12
2 688 
6
1 522 
2021 Q4
8
2 100 
8
1 856 
2021 Q3
9
2 489 
8
2 050 
2021 Q2
8
2 757 
6
1 538 
2021 Q1
7
1 607 
6
1 266 
2020 Q4
5
1 800 
9
1 526 
2020 Q3
7
1 845 
7
1 629 
2020 Q2
3
2 049 
6
1 638 
2020 Q1
8
2 144 
9
1 402 
2019 Q4
9
2 215 
1
1 418 
2019 Q3
9
2 359 
4
909 
2019 Q2
8
2 296 
4
1 976 
2019 Q1
9
2 141 
4
1 373 
2018 Q4
5
1 512 
5
1 325 
2018 Q3
9
1 716 
1
1 060 
2018 Q2
7
2 014 
5
1 757 
2018 Q1
4
2 250 
3
896 
2017 Q4
3
2 102 
2
2 372 
2017 Q3
9
2 116 
3
1 234 
2017 Q2
5
2 343 
2
1 751 
2017 Q1
1
2 320 
0
--- 
2016 Q4
3
924 
0
--- 
2016 Q3
6
1 732 
1
1 347 
2016 Q2
1
1 327 
3
1 215 
2016 Q1
3
1 798 
3
1 777 
2015 Q4
5
1 884 
5
1 833 
2015 Q3
5
1 793 
4
1 845 
2015 Q2
5
2 405 
3
2 289 
2015 Q1
4
1 992 
2
1 268 
2014 Q4
2
1 983 
2
2 065 
2014 Q3
7
2 048 
4
1 408 
2014 Q2
6
1 874 
5
1 826 
2014 Q1
2
2 003 
3
1 304 

Overview of the latest real estate transactions

The following list is an anonymized overview of the latest transactions. For more details and to find all transactions, please use the map to view transactions by plot or the transaction search page for a search by criteria.

2025-06-27
40 000 
Sale
Land
37 m2
-Sols
2025-06-25
342 075 
3 491  /m²(98 m²)
Sale
Land
235 m2
-Terrains d'agrément
/Jardin d'agrément
Land
378 m2
-Terrains d'agrément
/Jardin d'agrément
Houses
House
4 rooms
98 m2
1 outbuilding
Land
1261 m2
-Terrains d'agrément
/Jardin d'agrément
Land
1149 m2
-Sols
2025-06-04
18 000 
Sale
Land
9364 m2
-Prés
2025-05-05
290 000 
3 021  /m²(96 m²)
Sale
Houses
House
5 rooms
96 m2
Land
345 m2
-Sols
2025-04-30
85 000 
266  /m²(320 m²)
Sale
Commercial property
320 m2
2025-04-30
289 600 
2 681  /m²(108 m²)
Sale
Houses
House
4 rooms
108 m2
1 outbuilding
Land
1450 m2
-Terres
Land
500 m2
-Sols
Land
158 m2
-Sols
2025-04-29
194 550 
1 835  /m²(106 m²)
Sale
Apartments
Apartment
4 rooms
106 m2
2 outbuildings
2025-04-25
91 330 
1 450  /m²(63 m²)
Sale
Apartments
Apartment
3 rooms
63 m2
1 outbuilding
1 outbuilding
2025-04-24
960 
Sale
Land
960 m2
-Vignes
2025-04-24
216 930 
995  /m²(218 m²)
Sale
Apartments
Apartment
6 rooms
138 m2
Apartments
Apartment
3 rooms
80 m2
3 outbuildings
1 outbuilding
2025-04-08
149 000 
Sale
2 outbuildings
2025-04-03
130 000 
1 733  /m²(75 m²)
Sale
Houses
House
3 rooms
75 m2
Land
839 m2
-Sols
Land
48 m2
-Sols
2025-03-29
260 000 
788  /m²(330 m²)
Sale
Commercial property
330 m2
Land
1799 m2
-Sols
2025-03-28
405 250 
5 003  /m²(81 m²)
Sale
Houses
House
5 rooms
81 m2
Land
1000 m2
-Sols
Land
440 m2
-Terrains d'agrément
/Jardin d'agrément
Land
28 m2
-Sols
Land
73 m2
-Sols
Land
276 m2
-Terres
Land
314 m2
-Terrains d'agrément
/Jardin d'agrément
2025-03-24
15 000 
Sale
Land
23 m2
-Sols
2025-03-17
113 000 
934  /m²(121 m²)
Sale
Houses
House
4 rooms
121 m2
Land
103 m2
-Sols
Land
571 m2
-Prés
2025-03-17
1 
Sale
Land
4 m2
-Terrains à bâtir
Land
5 m2
-Terrains à bâtir
Land
6 m2
-Terrains à bâtir
2025-03-14
70 000 
1 667  /m²(42 m²)
Sale
Commercial property
42 m2
2025-03-13
1 
Sale
Land
2 m2
-Terrains à bâtir
2025-03-03
125 000 
510  /m²(245 m²)
Sale
Apartments
Apartment
6 rooms
245 m2
3 outbuildings
869 transactions listed in the municipality

Savoie (73)

Most expensive cities

City
name
Descending orderHouses
house
Price per m²
41 730 
15 064 
9 926 
8 106 
7 708 
7 667 
7 570 
6 752 
6 184 
City
name
Descending orderApartments
apt.
Price per m²
12 707 
12 414 
10 959 
10 302 
8 611 
6 667 
6 146 
6 116 
5 770 

Least expensive cities

City
name
Ascending orderHouses
house
Price per m²
1 250 
1 316 
1 333 
1 344 
1 354 
1 384 
1 500 
City
name
Ascending orderApartments
apt.
Price per m²
400 
520 
528 
672 
797