Real estate price map
Real estate price map in the municipality of Notre-Dame-du-Pré, choose a section to see transactions by parcel.
Savoie (73)
Price per m² in Notre-Dame-du-Pré
Median price of real estate
in the municipality of Notre-Dame-du-Pré
Houses
2 188 € /m²
Reliability 6/10
Median price on the 19 transactions of the last 36 months.
from 1 498 to
3 190 € /m²
3 190 € /m²
60% of transactions from the 2nd to the 8th deciles.
Apartments
2 454 € /m²
Reliability 5/10
Median price on the 12 transactions of the last 48 months.
from 2 190 to
2 997 € /m²
2 997 € /m²
60% of transactions from the 2nd to the 8th deciles.
Dwellings
2 303 € /m²
Reliability 7/10
Median price on the 21 transactions of the last 24 months.
from 1 735 to
3 095 € /m²
3 095 € /m²
60% of transactions from the 2nd to the 8th deciles.
Evolution of the price per m² of houses since...
1 year
+13%
2 years
-18%
3 years
-25%
4 years
+140%
5 years
-6.9%
6 years
+57%
7 years
+119%
8 years
-1.8%
9 years
+79%
10 years
--
11 years
--
The price per m² of houses has decreased by 25% since 3 years, but it has increased by 140% in 4 years.
Yearly evolution
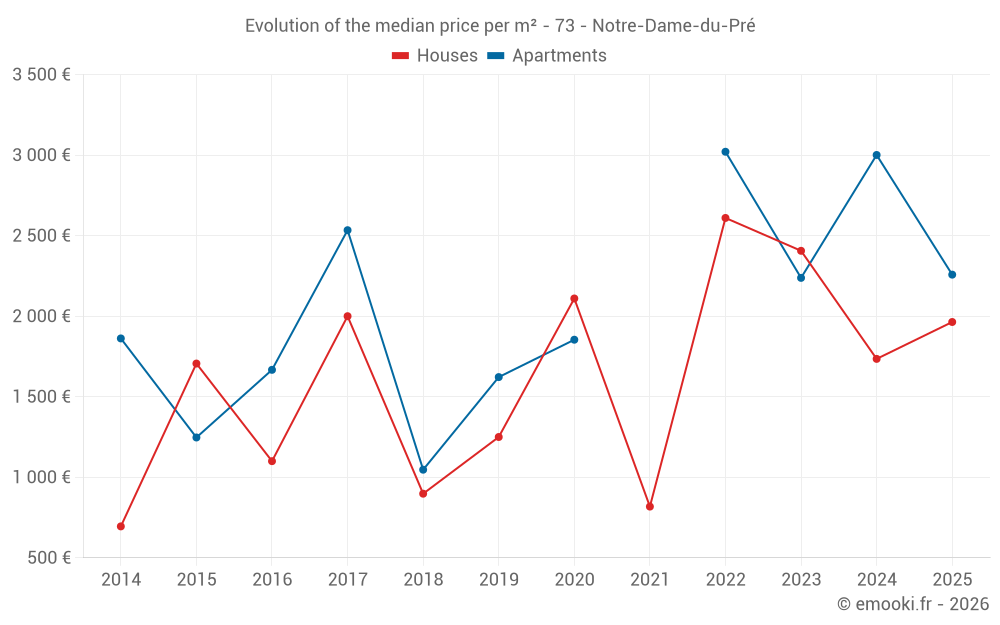
Evolution of the median price per m²
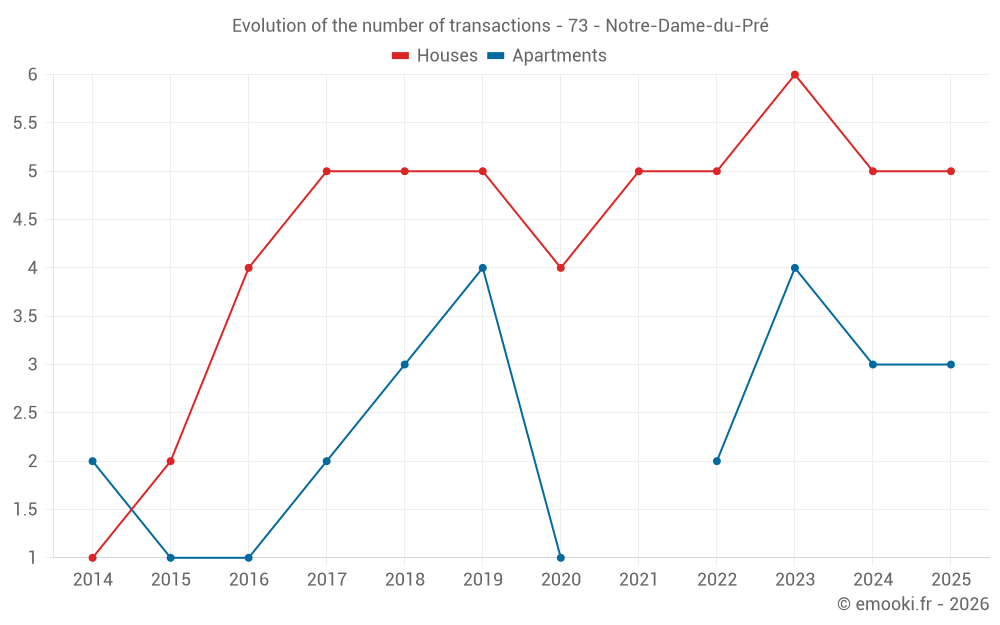
Evolution of the number of transactions
Warning, last year incomplete. Projections made based on the proportions between semesters of the previous year at the departmental/national level and by type of property.
Yearly data
Year
house
transactions
transactions
house
Price per m²
Price per m²
apt.
transactions
transactions
apt.
Price per m²
Price per m²
2025
5
1 964 €
3
2 258 €
2024
5
1 735 €
3
3 001 €
2023
6
2 406 €
4
2 238 €
2022
5
2 610 €
2
3 021 €
2021
5
818 €
0
--- €
2020
4
2 110 €
1
1 854 €
2019
5
1 250 €
4
1 622 €
2018
5
898 €
3
1 047 €
2017
5
2 000 €
2
2 534 €
2016
4
1 100 €
1
1 667 €
2015
2
1 706 €
1
1 247 €
2014
1
695 €
2
1 862 €
Analysis
Structure of prices per m²
Values of price percentiles per m² over the periods used for the estimated price of each type of property.
Structure of transaction amounts
Values of transaction amounts percentiles over the periods used for the estimated price of each type of property.
Transaction amounts and prices per m² by percentile
Percentile
house
Price per m²
Price per m²
house
Transaction amount
Transaction amount
apt.
Price per m²
Price per m²
apt.
Transaction amount
Transaction amount
10th percentile
1 107 €
35 800 €
2 168 €
56 836 €
20th percentile
1 498 €
73 000 €
2 190 €
60 500 €
30th percentile
1 778 €
101 K€
2 272 €
64 478 €
40th percentile
1 966 €
152 K€
2 345 €
71 243 €
50th percentile
2 188 €
168 K€
2 454 €
76 232 €
60th percentile
2 304 €
183 K€
2 658 €
94 200 €
70th percentile
2 783 €
224 K€
2 914 €
147 K€
80th percentile
3 190 €
271 K€
2 997 €
222 K€
90th percentile
3 369 €
307 K€
3 108 €
242 K€
National and departmental comparison
Evolution of the median price per m² of houses
Evolution of the median price per m² of apartments
Quarterly evolution
Evolution of the median price per m²
Evolution of the number of transactions
Quarterly data
Quarter
house
transactions
transactions
house
Price per m²
Price per m²
apt.
transactions
transactions
apt.
Price per m²
Price per m²
2025 Q2
3
3 333 €
3
2 258 €
2025 Q1
2
1 024 €
0
--- €
2024 Q4
1
2 312 €
1
3 120 €
2024 Q3
1
1 134 €
1
2 500 €
2024 Q2
1
1 319 €
1
3 001 €
2024 Q1
2
1 962 €
0
--- €
2023 Q4
1
3 369 €
2
2 290 €
2023 Q3
1
3 095 €
1
2 303 €
2023 Q2
2
2 258 €
1
2 167 €
2023 Q1
2
2 056 €
0
--- €
2022 Q4
1
2 944 €
1
2 763 €
2022 Q3
2
2 186 €
0
--- €
2022 Q2
2
2 288 €
1
3 279 €
2021 Q4
2
2 148 €
0
--- €
2021 Q2
2
1 642 €
0
--- €
2021 Q1
1
500 €
0
--- €
2020 Q4
1
1 719 €
0
--- €
2020 Q3
2
2 269 €
0
--- €
2020 Q1
1
2 500 €
1
1 854 €
2019 Q4
3
1 250 €
2
1 972 €
2019 Q3
1
1 111 €
0
--- €
2019 Q2
1
2 174 €
1
1 364 €
2019 Q1
0
--- €
1
1 375 €
2018 Q4
1
769 €
1
1 047 €
2018 Q3
2
952 €
2
2 102 €
2018 Q2
1
1 471 €
0
--- €
2018 Q1
1
363 €
0
--- €
2017 Q3
2
2 161 €
1
3 317 €
2017 Q2
2
2 094 €
0
--- €
2017 Q1
1
1 778 €
1
1 751 €
2016 Q4
1
449 €
0
--- €
2016 Q3
1
2 938 €
0
--- €
2016 Q2
1
1 199 €
0
--- €
2016 Q1
1
1 000 €
1
1 667 €
2015 Q4
1
2 744 €
0
--- €
2015 Q1
1
667 €
1
1 247 €
2014 Q3
0
--- €
1
1 520 €
2014 Q1
1
695 €
1
2 205 €
Overview of the latest real estate transactions
The following list is an anonymized overview of the latest transactions. For more details and to find all transactions, please use the map to view transactions by plot or the transaction search page for a search by criteria.
2025-06-27
88 €Sale
Land
220 m2
-Futaies mixtes
2025-06-10
74 465 €2 979 € /m²(25 m²)
Sale
Apartment
1 room
25 m2
1 outbuilding
2025-05-13
150 000 €3 333 € /m²(45 m²)
Sale
House
1 room
45 m2
Land
687 m2
-Sols
Land
54 m2
-Sols
Land
143 m2
-Terres
2025-04-29
192 500 €1 964 € /m²(98 m²)
Sale
House
3 rooms
50 m2
Land
225 m2
-Sols
House
2 rooms
48 m2
Land
100 m2
-Sols
Land
64 m2
-Terres
Land
7 m2
-Vignes
Land
58 m2
-Terres
Land
66 m2
-Terres
Land
95 m2
-Jardins
2025-04-24
350 000 €2 258 € /m²(155 m²)
Sale
Apartment
5 rooms
111 m2
Apartment
2 rooms
44 m2
Land
641 m2
-Terrains à bâtir
Land
69 m2
-Prés
Land
112 m2
-Prés
Land
89 m2
-Prés
Land
86 m2
-Prés
Land
95 m2
-Prés
Land
87 m2
-Vergers
2025-04-11
60 000 €2 000 € /m²(30 m²)
Sale
Apartment
1 room
30 m2
1 outbuilding
2025-04-11
352 700 €3 527 € /m²(100 m²)
Sale
House
4 rooms
100 m2
Land
627 m2
-Sols
2025-03-31
1 231 €Sale
Land
2374 m2
-Prés
Land
65 m2
-Vignes
Land
23 m2
-Taillis simples
2025-02-07
55 000 €1 618 € /m²(34 m²)
Sale
House
1 room
34 m2
Land
90 m2
-Sols
Land
98 m2
-Terrains à bâtir
Land
34 m2
-Jardins
Land
31 m2
-Jardins
Land
37 m2
-Jardins
Land
224 m2
-Vergers
2025-01-22
36 000 €Sale
Land
83 m2
-Prés
Land
201 m2
-Prés
Land
540 m2
-Terres
Land
1255 m2
-Prés
2025-01-08
12 000 €429 € /m²(28 m²)
Sale
House
1 room
28 m2
Land
48 m2
-Sols
2024-11-28
184 990 €2 312 € /m²(80 m²)
Sale
House
3 rooms
80 m2
Land
681 m2
-Sols
Land
142 m2
-Terres
Land
61 m2
-Jardins
Land
122 m2
-Jardins
2024-11-25
78 000 €3 120 € /m²(25 m²)
Sale
Apartment
1 room
25 m2
2024-10-04
2 500 €Sale
Land
164 m2
-Vergers
2024-10-01
270 €Sale
Land
35 m2
-Prés
Land
19 m2
-Prés
2024-10-01
275 €Sale
Land
55 m2
-Prés
2024-08-22
450 €Sale
Land
160 m2
-Prés
Land
204 m2
-Prés
Land
595 m2
-Futaies mixtes
Land
1440 m2
-Futaies mixtes
Land
960 m2
-Prés
Land
780 m2
-Prés
2024-08-01
30 000 €Sale
Land
36 m2
-Sols
Land
100 m2
-Prés
Land
35 m2
-Prés
2024-07-08
62 500 €2 500 € /m²(25 m²)
Sale
Apartment
1 room
25 m2
2024-07-08
110 000 €1 134 € /m²(97 m²)
Sale
House
1 room
30 m2
Land
68 m2
-Sols
House
1 room
55 m2
Land
69 m2
-Sols
House
12 m2
Land
75 m2
-Sols
Land
43 m2
-Jardins
Land
55 m2
-Vergers
Land
75 m2
-Vergers
Land
82 m2
-Vergers
Land
65 m2
-Vergers
137 transactions listed in the municipality
Compare with neighboring municipalities
City
name
name
house
Price per m²
Price per m²
apt.
Price per m²
Price per m²
City information
Zip code
- 73600 NOTRE DAME DU PRE
Data source & update
- Latest publication of the property value request (DVF) database made available by the DGFiP on October 19, 2025, covering transactions up to 06/30/2025:
- Administrative/cadastral division as of September 1, 2025, and municipal movements as of January 1, 2025: