emooki
SearchPrice mapTransactions
🇬🇧 English🇫🇷 Français🇩🇪 Deutsch🇪🇸 Español🇮🇹 Italiano

Real estate price map


Real estate price map in the municipality of Brison-Saint-Innocent.

Savoie (73)
Brison-Saint-Innocent

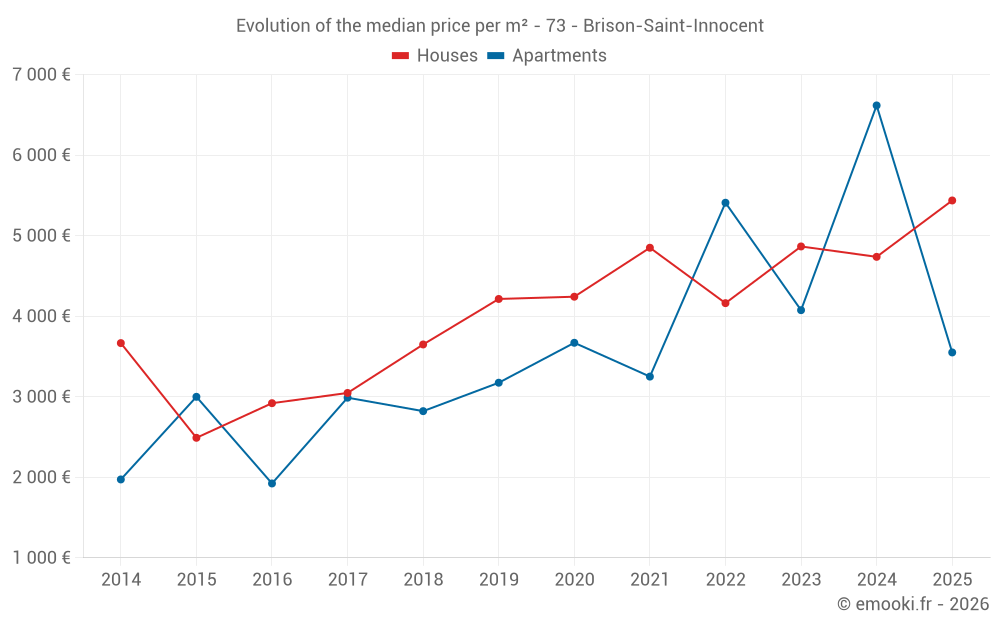
Median price of real estate
in the municipality of Brison-Saint-Innocent

HousesHouses
5 959 € /m²
1-23-45-67-89-10
Reliability 8/10
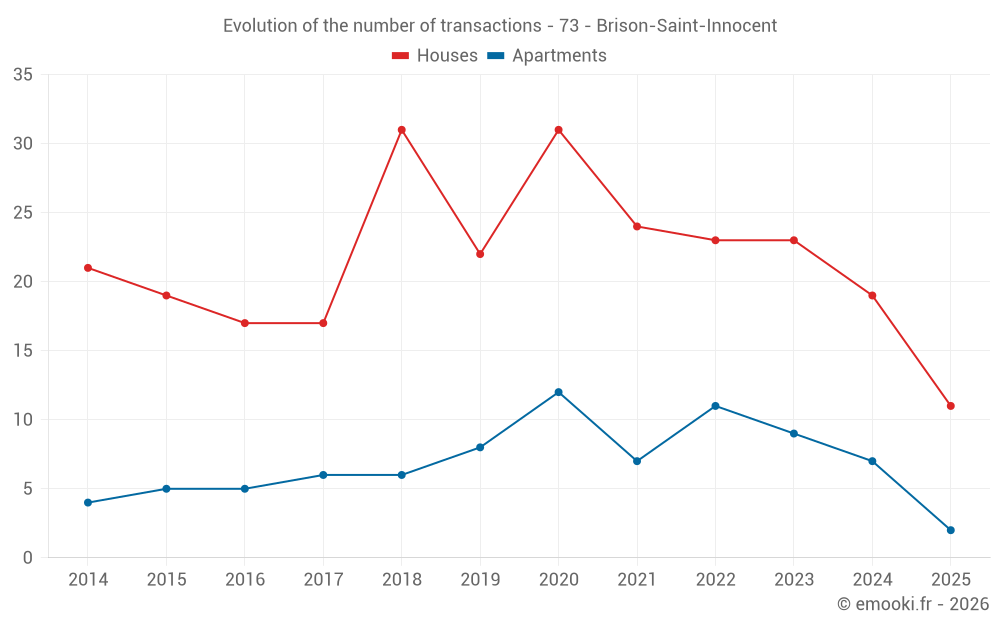
Median price on the 17 transactions of the last 12 months.
from 4 833 to
7 148 € /m²
60% of transactions from the 2nd to the 8th deciles.
ApartmentsApartments
5 454 € /m²
1-23-45-67-89-10
Reliability 7/10
Median price on the 15 transactions of the last 24 months.
from 3 332 to
7 412 € /m²
60% of transactions from the 2nd to the 8th deciles.
DwellingsDwellings
6 166 € /m²
1-23-45-67-89-10
Reliability 8/10
Median price on the 24 transactions of the last 12 months.
from 4 333 to
7 544 € /m²
60% of transactions from the 2nd to the 8th deciles.
HousesEvolution of the price per m² of houses
1 year
+14.8%
2 years
+11.7%
3 years
+30.6%
4 years
+12.1%
5 years
+28.2%
6 years
+29%
7 years
+49%
8 years
+78.4%
9 years
+86.2%
10 years
+118.4%
11 years
+48.3%
ApartmentsEvolution of the price per m² of apartments
1 year
--
2 years
--
3 years
--
4 years
--
5 years
--
6 years
--
7 years
--
8 years
--
9 years
--
10 years
--
11 years
--

Yearly evolution

Median price per m²

Number of transactions

Warning, last year incomplete. Projections made based on the proportions between semesters of the previous year at the departmental/national level and by type of property.

Yearly data

Descending order
Year
Houses
house
Price per m²
Houses
house
transactions
Apartments
apt.
Price per m²
Apartments
apt.
transactions
2025
5 437 €
11
3 550 €
2
2024
4 737 €
19
6 617 €
7
2023
4 866 €
23
4 075 €
9
2022
4 162 €
23
5 409 €
11
2021
4 850 €
24
3 250 €
7
2020
4 242 €
31
3 670 €
12
2019
4 214 €
22
3 174 €
8
2018
3 649 €
31
2 821 €
6
2017
3 047 €
17
2 988 €
6
2016
2 920 €
17
1 923 €
5
2015
2 490 €
19
2 999 €
5
2014
3 666 €
21
1 973 €
4

Quarterly evolution

Median price per m²

Number of transactions

Analysis

Structure of prices per m²

Values of price percentiles per m² over the periods used for the estimated price of each type of property.

Savoie (73)

Most expensive cities

City
name
Descending orderHouses
house
Price per m²
41 730 €
15 064 €
9 926 €
8 106 €
7 708 €
7 667 €
7 570 €
6 752 €
6 185 €
6 184 €
City
name
Descending orderApartments
apt.
Price per m²
12 707 €
12 414 €
10 959 €
10 302 €
8 611 €
6 667 €
6 146 €
6 116 €
5 907 €
5 770 €

Least expensive cities

City
name
Ascending orderHouses
house
Price per m²
1 219 €
1 250 €
1 316 €
1 333 €
1 344 €
1 354 €
1 384 €
1 403 €
1 456 €
1 500 €
City
name
Ascending orderApartments
apt.
Price per m²
188 €
296 €
368 €
400 €
520 €
528 €
532 €
596 €
672 €
797 €