emooki
HomePrice mapTransactions
🇬🇧 English🇫🇷 Français🇩🇪 Deutsch🇪🇸 Español🇮🇹 Italiano

Real estate price map


Real estate price map in the municipality of Saint-Bonnet-de-Mure, choose a section to see transactions by parcel.

Rhône (69)
Saint-Bonnet-de-Mure

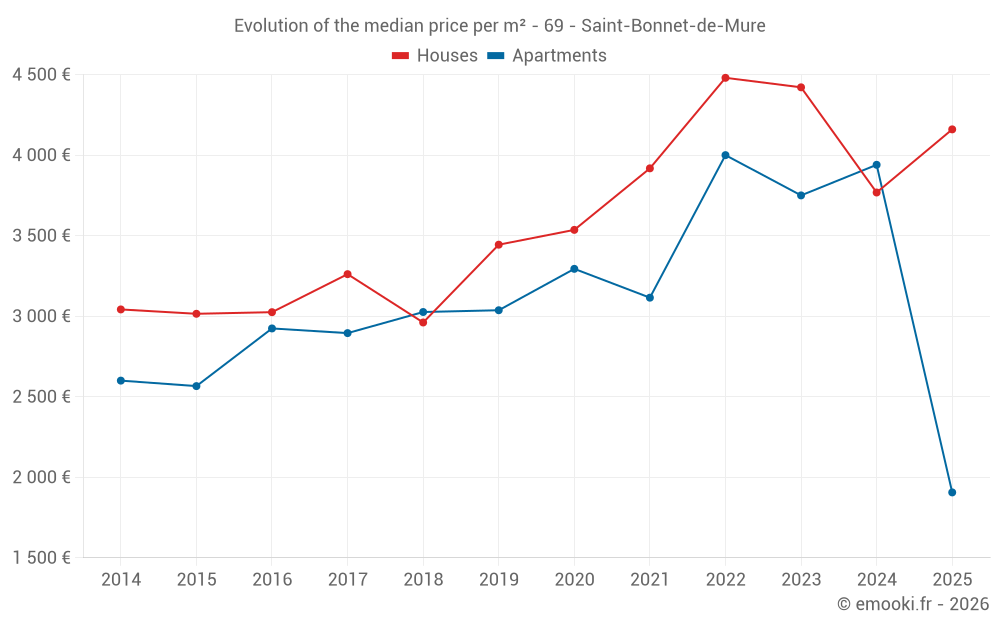
Median price of real estate
in the municipality of Saint-Bonnet-de-Mure

HousesHouses
3 872 € /m²
1-23-45-67-89-10
Reliability 8/10
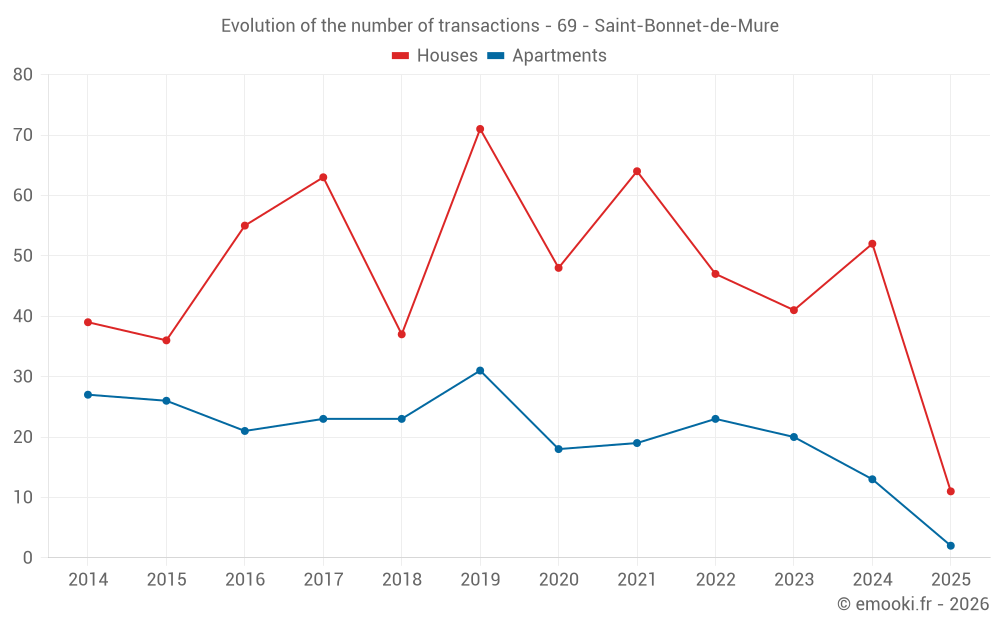
Median price on the 44 transactions of the last 12 months.
from 3 059 to
4 822 € /m²
60% of transactions from the 2nd to the 8th deciles.
ApartmentsApartments
3 445 € /m²
1-23-45-67-89-10
Reliability 7/10
Median price on the 23 transactions of the last 24 months.
from 2 359 to
4 547 € /m²
60% of transactions from the 2nd to the 8th deciles.
DwellingsDwellings
3 706 € /m²
1-23-45-67-89-10
Reliability 8/10
Median price on the 55 transactions of the last 12 months.
from 2 894 to
4 819 € /m²
60% of transactions from the 2nd to the 8th deciles.
HousesEvolution of the price per m² of houses since...
1 year
+10%
2 years
-5.9%
3 years
-7.1%
4 years
+6.2%
5 years
+18%
6 years
+21%
7 years
+40%
8 years
+28%
9 years
+38%
10 years
+38%
11 years
+37%
The price per m² of houses has decreased by 7.1% since 3 years, but it has increased by 40% in 7 years.

Yearly evolution

Evolution of the median price per m²

Evolution of the number of transactions

Warning, last year incomplete. Projections made based on the proportions between semesters of the previous year at the departmental/national level and by type of property.

Yearly data

Descending order
Year
Houses
house
transactions
Houses
house
Price per m²
Apartments
apt.
transactions
Apartments
apt.
Price per m²
2025
11
4 160 €
2
1 906 €
2024
52
3 768 €
13
3 940 €
2023
41
4 421 €
20
3 750 €
2022
47
4 480 €
23
4 000 €
2021
64
3 918 €
19
3 115 €
2020
48
3 536 €
18
3 294 €
2019
71
3 444 €
31
3 037 €
2018
37
2 961 €
23
3 026 €
2017
63
3 261 €
23
2 895 €
2016
55
3 025 €
21
2 924 €
2015
36
3 015 €
26
2 566 €
2014
39
3 042 €
27
2 600 €

Analysis

Structure of prices per m²

Values of price percentiles per m² over the periods used for the estimated price of each type of property.

Structure of transaction amounts

Values of transaction amounts percentiles over the periods used for the estimated price of each type of property.

Transaction amounts and prices per m² by percentile

Ascending order
Percentile
Houses
house
Price per m²
Houses
house
Transaction amount
Apartments
apt.
Price per m²
Apartments
apt.
Transaction amount
10th percentile
2 794 €
287 K€
2 161 €
125 K€
20th percentile
3 059 €
312 K€
2 359 €
156 K€
30th percentile
3 272 €
338 K€
2 831 €
178 K€
40th percentile
3 480 €
375 K€
3 361 €
196 K€
50th percentile
3 872 €
398 K€
3 445 €
220 K€
60th percentile
4 145 €
446 K€
3 973 €
234 K€
70th percentile
4 723 €
470 K€
4 269 €
272 K€
80th percentile
4 822 €
520 K€
4 547 €
286 K€
90th percentile
5 157 €
673 K€
4 801 €
309 K€

National and departmental comparison

Evolution of the median price per m² of houses

Evolution of the median price per m² of apartments

Quarterly evolution

Evolution of the median price per m²

Evolution of the number of transactions

Quarterly data

Descending order
Quarter
Houses
house
transactions
Houses
house
Price per m²
Apartments
apt.
transactions
Apartments
apt.
Price per m²
2025 Q2
7
4 160 €
0
--- €
2025 Q1
4
4 450 €
2
1 906 €
2024 Q4
12
3 481 €
4
4 695 €
2024 Q3
21
4 085 €
5
3 656 €
2024 Q2
8
4 210 €
2
3 108 €
2024 Q1
11
3 626 €
2
4 376 €
2023 Q4
9
4 052 €
3
2 471 €
2023 Q3
12
3 982 €
5
4 103 €
2023 Q2
7
4 598 €
8
3 852 €
2023 Q1
13
4 636 €
4
3 888 €
2022 Q4
6
4 514 €
7
3 611 €
2022 Q3
15
4 666 €
8
4 194 €
2022 Q2
14
4 105 €
3
4 040 €
2022 Q1
12
4 530 €
5
3 763 €
2021 Q4
14
4 256 €
6
3 103 €
2021 Q3
28
3 996 €
5
4 167 €
2021 Q2
13
3 887 €
3
2 778 €
2021 Q1
9
3 663 €
5
2 788 €
2020 Q4
12
3 426 €
4
4 344 €
2020 Q3
18
3 717 €
4
3 570 €
2020 Q2
11
3 752 €
4
2 950 €
2020 Q1
7
3 246 €
6
2 967 €
2019 Q4
18
3 678 €
10
2 990 €
2019 Q3
19
3 556 €
6
3 072 €
2019 Q2
15
3 587 €
11
2 763 €
2019 Q1
19
3 031 €
4
3 396 €
2018 Q4
10
2 742 €
6
2 723 €
2018 Q3
15
3 314 €
8
3 236 €
2018 Q2
7
2 872 €
7
3 026 €
2018 Q1
5
3 199 €
2
2 980 €
2017 Q4
14
3 491 €
6
3 220 €
2017 Q3
19
3 037 €
6
2 865 €
2017 Q2
15
3 180 €
3
2 895 €
2017 Q1
15
3 104 €
8
2 694 €
2016 Q4
12
3 102 €
6
3 100 €
2016 Q3
25
2 999 €
10
2 566 €
2016 Q2
12
2 628 €
1
2 431 €
2016 Q1
6
3 138 €
4
3 164 €
2015 Q4
9
3 154 €
9
2 368 €
2015 Q3
17
2 968 €
4
2 978 €
2015 Q2
6
3 142 €
10
2 516 €
2015 Q1
4
2 906 €
3
3 065 €
2014 Q4
10
2 548 €
4
2 542 €
2014 Q3
15
3 277 €
7
3 216 €
2014 Q2
8
3 036 €
6
2 306 €
2014 Q1
6
3 226 €
10
2 552 €

Overview of the latest real estate transactions

The following list is an anonymized overview of the latest transactions. For more details and to find all transactions, please use the map to view transactions by plot or the transaction search page for a search by criteria.

2025-06-10
740 000 €
11 563 € /m²(64 m²)
Sale
Houses
House
3 rooms
64 m2
1 outbuilding
Land
1908 m2
-Prés
Land
2672 m2
-Sols
2025-06-03
175 000 €
583 € /m²(300 m²)
Sale
Land
1206 m2
-Sols
Commercial property
150 m2
Land
163 m2
-Sols
Commercial property
150 m2
Land
730 m2
-Sols
2025-06-02
485 000 €
1 228 € /m²(395 m²)
Sale
Commercial property
395 m2
Land
1500 m2
-Sols
2025-06-02
870 000 €
686 € /m²(1268 m²)
Sale
Commercial property
526 m2
Land
2384 m2
-Sols
Commercial property
742 m2
Land
2120 m2
-Sols
2025-05-26
17 000 €
Sale
1 outbuilding
2025-05-21
158 667 €
1 141 € /m²(139 m²)
Sale
Houses
House
6 rooms
139 m2
1 outbuilding
Land
762 m2
-Sols
2025-05-15
284 000 €
Sale
1 outbuilding
2025-05-15
453 400 €
4 160 € /m²(109 m²)
Sale
Houses
House
7 rooms
109 m2
Land
942 m2
-Sols
2025-04-29
412 750 €
4 856 € /m²(85 m²)
Sale
Houses
House
3 rooms
85 m2
Land
495 m2
-Terrains d'agrément
Land
566 m2
-Sols
2025-04-25
118 000 €
1 255 € /m²(94 m²)
Sale
Houses
House
5 rooms
94 m2
1 outbuilding
2025-04-25
1 €
Sale
Land
2798 m2
-Terrains d'agrément
2025-04-16
695 836 €
699 € /m²(995 m²)
Sale
Commercial property
995 m2
Land
2180 m2
-Sols
2025-04-16
2 200 000 €
2 211 € /m²(995 m²)
Sale
Commercial property
995 m2
Land
2180 m2
-Sols
Land
135 m2
-Sols
2025-04-16
340 000 €
5 075 € /m²(67 m²)
Sale
Houses
House
3 rooms
67 m2
Land
441 m2
-Sols
Land
699 m2
-Terrains d'agrément
2025-04-04
292 000 €
3 209 € /m²(91 m²)
Sale
Houses
House
5 rooms
91 m2
Land
750 m2
-Sols
2025-03-25
275 000 €
Sale
Land
758 m2
-Terrains à bâtir
Land
48 m2
-Sols
2025-03-20
110 942 €
1 819 € /m²(61 m²)
Sale
Apartments
Apartment
3 rooms
61 m2
1 outbuilding
1 outbuilding
2025-03-18
289 000 €
4 817 € /m²(60 m²)
Sale
Houses
House
4 rooms
60 m2
Land
965 m2
-Sols
2025-02-25
15 000 €
Sale
Land
100 m2
-Sols
2025-02-25
315 000 €
733 € /m²(430 m²)
Sale
Commercial property
300 m2
Commercial property
130 m2
Land
241 m2
-Sols
1366 transactions listed in the municipality

Rhône (69)

Most expensive cities

City
name
Descending orderHouses
house
Price per m²
8 086 €
7 283 €
6 120 €
5 946 €
5 868 €
5 739 €
5 654 €
5 529 €
5 484 €
5 467 €
City
name
Descending orderApartments
apt.
Price per m²
5 536 €
5 308 €
5 064 €
4 817 €
4 729 €
4 719 €
4 717 €
4 627 €
4 571 €
4 505 €

Least expensive cities

City
name
Ascending orderHouses
house
Price per m²
744 €
915 €
1 104 €
1 250 €
1 250 €
1 250 €
1 260 €
1 291 €
1 351 €
1 360 €
City
name
Ascending orderApartments
apt.
Price per m²
428 €
460 €
470 €
529 €
581 €
593 €
650 €
667 €