emooki
HomePrice mapTransactions
🇬🇧 English🇫🇷 Français🇩🇪 Deutsch🇪🇸 Español🇮🇹 Italiano

Real estate price map


Real estate price map in the municipality of Villié-Morgon.

Rhône (69)
Villié-Morgon

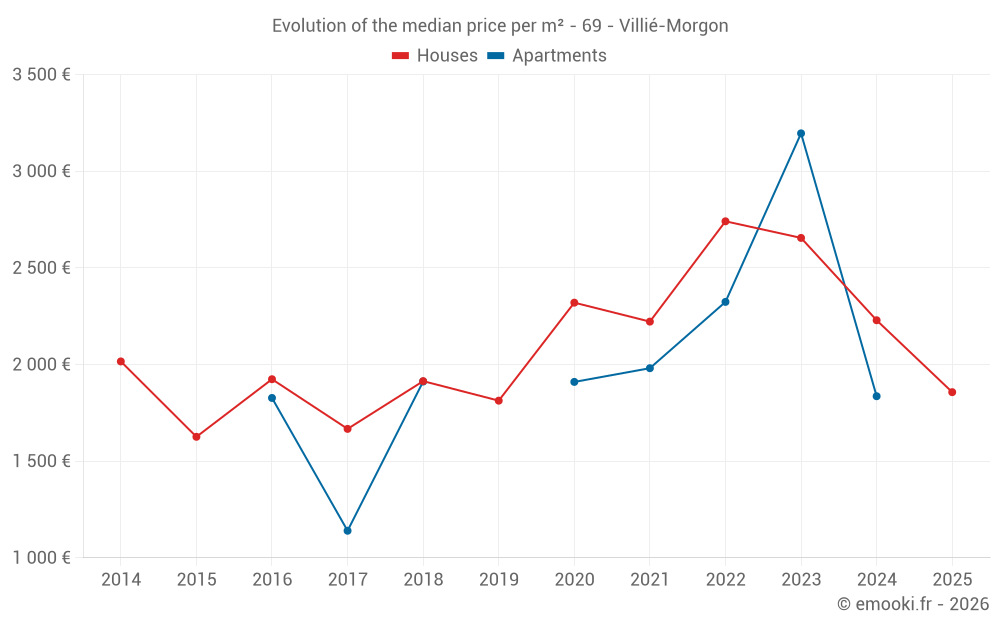
Median price of real estate
in the municipality of Villié-Morgon

HousesHouses
2 066  /m²
1-23-45-67-89-10
Reliability 7/10
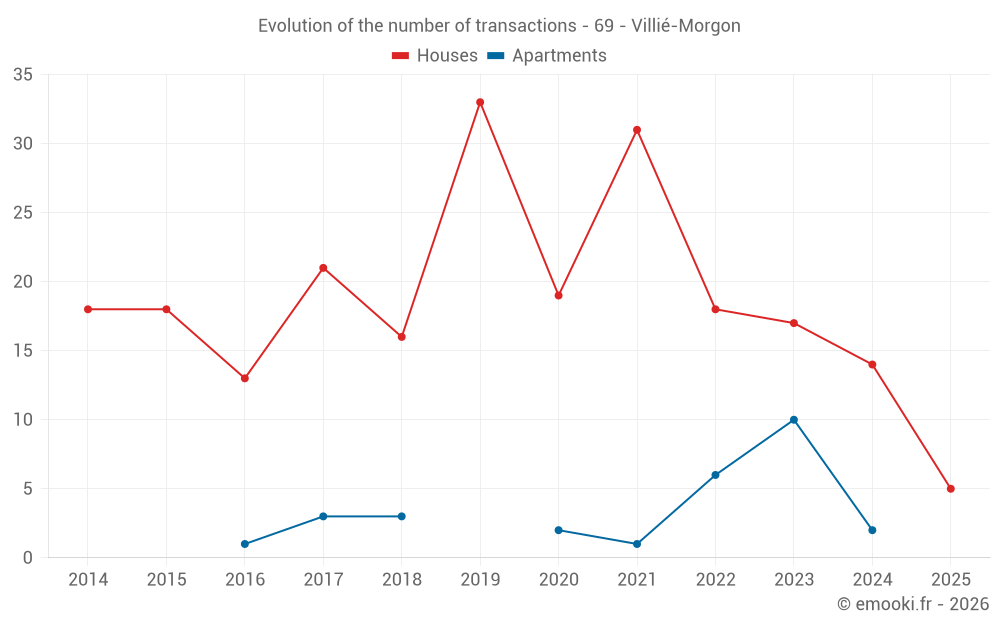
Median price on the 25 transactions of the last 24 months.
from 1 617 to
2 700  /m²
60% of transactions from the 2nd to the 8th deciles.
ApartmentsApartments
3 148  /m²
1-23-45-67-89-10
Reliability 6/10
Median price on the 12 transactions of the last 36 months.
from 2 899 to
3 285  /m²
60% of transactions from the 2nd to the 8th deciles.
DwellingsDwellings
2 118  /m²
1-23-45-67-89-10
Reliability 7/10
Median price on the 28 transactions of the last 24 months.
from 1 564 to
2 774  /m²
60% of transactions from the 2nd to the 8th deciles.
HousesEvolution of the price per m² of houses since...
1 year
-17%
2 years
-30%
3 years
-32%
4 years
-16%
5 years
-20%
6 years
+2.4%
7 years
-3%
8 years
+11%
9 years
-3.5%
10 years
+14%
11 years
-7.9%
ApartmentsEvolution of the price per m² of apartments since...
1 year
--
2 years
--
3 years
--
4 years
--
5 years
--
6 years
--
7 years
--
8 years
--
9 years
--
10 years
--
11 years
--

Yearly evolution

Evolution of the median price per m²

Evolution of the number of transactions

Warning, last year incomplete. Projections made based on the proportions between semesters of the previous year at the departmental/national level and by type of property.

Yearly data

Descending order
Year
Houses
house
transactions
Houses
house
Price per m²
Apartments
apt.
transactions
Apartments
apt.
Price per m²
2025
5
1 857 
0
--- 
2024
14
2 229 
2
1 836 
2023
17
2 655 
10
3 196 
2022
18
2 741 
6
2 324 
2021
31
2 222 
1
1 981 
2020
19
2 320 
2
1 910 
2019
33
1 813 
0
--- 
2018
16
1 914 
3
1 912 
2017
21
1 667 
3
1 140 
2016
13
1 924 
1
1 827 
2015
18
1 626 
0
--- 
2014
18
2 016 
0
--- 

Analysis

Structure of prices per m²

Values of price percentiles per m² over the periods used for the estimated price of each type of property.

Structure of transaction amounts

Values of transaction amounts percentiles over the periods used for the estimated price of each type of property.

Transaction amounts and prices per m² by percentile

Ascending order
Percentile
Houses
house
Price per m²
Houses
house
Transaction amount
Apartments
apt.
Price per m²
Apartments
apt.
Transaction amount
10th percentile
1 438 
125 K
2 533 
147 K
20th percentile
1 617 
160 K
2 899 
161 K
30th percentile
1 762 
201 K
3 091 
166 K
40th percentile
1 948 
216 K
3 116 
170 K
50th percentile
2 066 
235 K
3 148 
176 K
60th percentile
2 303 
281 K
3 202 
192 K
70th percentile
2 407 
325 K
3 226 
200 K
80th percentile
2 700 
351 K
3 285 
204 K
90th percentile
3 157 
410 K
3 305 
205 K

National and departmental comparison

Evolution of the median price per m² of houses

Evolution of the median price per m² of apartments

Quarterly evolution

Evolution of the median price per m²

Evolution of the number of transactions

Quarterly data

Descending order
Quarter
Houses
house
transactions
Houses
house
Price per m²
Apartments
apt.
transactions
Apartments
apt.
Price per m²
2025 Q2
2
1 696 
0
--- 
2025 Q1
3
1 857 
0
--- 
2024 Q4
4
2 229 
0
--- 
2024 Q3
3
2 423 
0
--- 
2024 Q2
4
2 420 
1
1 176 
2024 Q1
3
1 339 
1
2 497 
2023 Q4
4
2 767 
0
--- 
2023 Q3
2
1 788 
1
2 853 
2023 Q2
4
2 490 
1
3 300 
2023 Q1
7
2 687 
8
3 196 
2022 Q4
5
2 912 
0
--- 
2022 Q3
3
3 991 
0
--- 
2022 Q2
6
2 136 
4
2 324 
2022 Q1
4
2 228 
2
2 324 
2021 Q4
8
1 486 
0
--- 
2021 Q3
7
2 500 
1
1 981 
2021 Q2
3
1 428 
0
--- 
2021 Q1
13
2 650 
0
--- 
2020 Q4
6
2 122 
0
--- 
2020 Q3
5
2 553 
1
2 786 
2020 Q2
6
2 400 
1
1 035 
2020 Q1
2
1 509 
0
--- 
2019 Q4
11
1 818 
0
--- 
2019 Q3
10
1 846 
0
--- 
2019 Q2
5
1 571 
0
--- 
2019 Q1
7
1 593 
0
--- 
2018 Q4
4
1 719 
0
--- 
2018 Q3
2
1 882 
2
1 283 
2018 Q2
5
2 073 
0
--- 
2018 Q1
5
1 833 
1
2 399 
2017 Q4
4
1 720 
2
1 732 
2017 Q3
9
1 362 
0
--- 
2017 Q2
4
1 877 
1
1 140 
2017 Q1
4
1 812 
0
--- 
2016 Q4
3
2 317 
0
--- 
2016 Q3
2
1 542 
1
1 827 
2016 Q2
6
1 966 
0
--- 
2016 Q1
2
2 064 
0
--- 
2015 Q4
7
1 275 
0
--- 
2015 Q3
5
1 573 
0
--- 
2015 Q2
3
1 678 
0
--- 
2015 Q1
3
2 176 
0
--- 
2014 Q4
5
2 289 
0
--- 
2014 Q3
4
1 302 
0
--- 
2014 Q2
3
1 468 
0
--- 
2014 Q1
6
2 094 
0
--- 

Rhône (69)

Most expensive cities

City
name
Descending orderHouses
house
Price per m²
5 868 
5 484 
City
name
Descending orderApartments
apt.
Price per m²
4 729 
4 719 
4 505 

Least expensive cities

City
name
Ascending orderHouses
house
Price per m²
744 
915 
1 250 
1 260 
City
name
Ascending orderApartments
apt.
Price per m²
428 
470 
529 
593