emooki
HomePrice mapTransactions
🇬🇧 English🇫🇷 Français🇩🇪 Deutsch🇪🇸 Español🇮🇹 Italiano

Real estate price map


Real estate price map in the municipality of Saint-Vérand.

Rhône (69)
Saint-Vérand

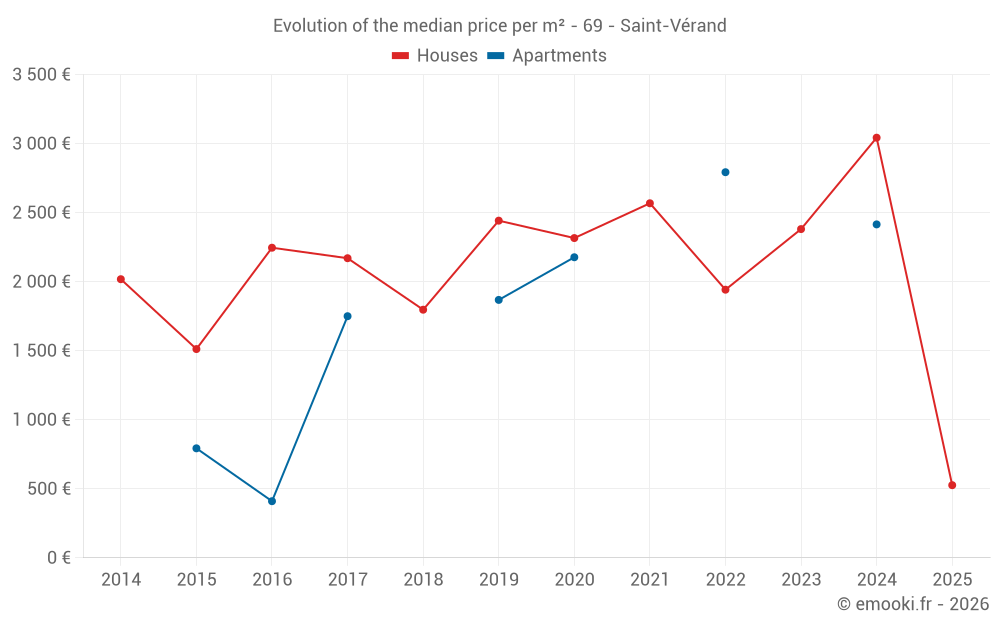
Median price of real estate
in the municipality of Saint-Vérand

HousesHouses
3 043  /m²
1-23-45-67-89-10
Reliability 7/10
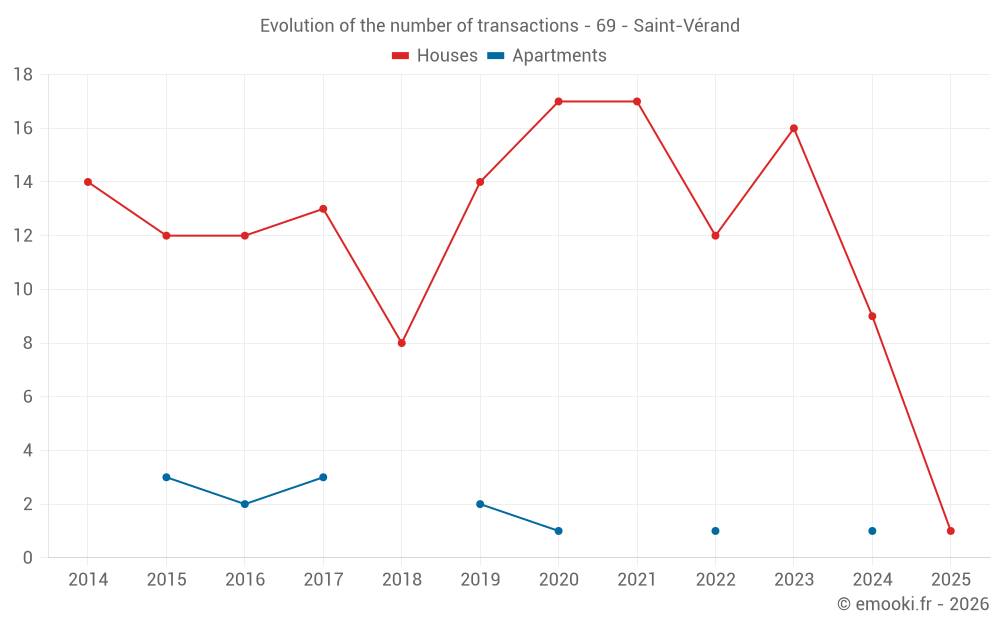
Median price on the 19 transactions of the last 24 months.
from 2 071 to
3 985  /m²
60% of transactions from the 2nd to the 8th deciles.
ApartmentsApartments
2 356  /m²
1-23-45-67-89-10
Reliability 2/10
Median price on the 5 transactions of the last 96 months.
DwellingsDwellings
2 786  /m²
1-23-45-67-89-10
Reliability 7/10
Median price on the 20 transactions of the last 24 months.
from 2 094 to
3 940  /m²
60% of transactions from the 2nd to the 8th deciles.
HousesEvolution of the price per m² of houses since...
1 year
--
2 years
--
3 years
--
4 years
--
5 years
--
6 years
--
7 years
--
8 years
--
9 years
--
10 years
--
11 years
--
ApartmentsEvolution of the price per m² of apartments since...
1 year
--
2 years
--
3 years
--
4 years
--
5 years
--
6 years
--
7 years
--
8 years
--
9 years
--
10 years
--
11 years
--

Yearly evolution

Evolution of the median price per m²

Evolution of the number of transactions

Warning, last year incomplete. Projections made based on the proportions between semesters of the previous year at the departmental/national level and by type of property.

Yearly data

Descending order
Year
Houses
house
transactions
Houses
house
Price per m²
Apartments
apt.
transactions
Apartments
apt.
Price per m²
2025
1
526 
0
--- 
2024
9
3 043 
1
2 415 
2023
16
2 381 
0
--- 
2022
12
1 942 
1
2 793 
2021
17
2 568 
0
--- 
2020
17
2 316 
1
2 177 
2019
14
2 442 
2
1 868 
2018
8
1 797 
0
--- 
2017
13
2 170 
3
1 750 
2016
12
2 246 
2
410 
2015
12
1 512 
3
793 
2014
14
2 018 
0
--- 

Analysis

Structure of prices per m²

Values of price percentiles per m² over the periods used for the estimated price of each type of property.

Structure of transaction amounts

Values of transaction amounts percentiles over the periods used for the estimated price of each type of property.

Transaction amounts and prices per m² by percentile

Ascending order
Percentile
Houses
house
Price per m²
Houses
house
Transaction amount
Apartments
apt.
Price per m²
Apartments
apt.
Transaction amount
10th percentile
1 417 
124 K
1 698 
103 K
20th percentile
2 071 
159 K
2 017 
105 K
30th percentile
2 292 
183 K
2 213 
109 K
40th percentile
2 488 
228 K
2 284 
115 K
50th percentile
3 043 
280 K
2 356 
120 K
60th percentile
3 257 
317 K
2 380 
128 K
70th percentile
3 579 
339 K
2 403 
135 K
80th percentile
3 985 
400 K
2 491 
168 K
90th percentile
5 156 
446 K
2 642 
227 K

National and departmental comparison

Evolution of the median price per m² of houses

Evolution of the median price per m² of apartments

Quarterly evolution

Evolution of the median price per m²

Evolution of the number of transactions

Quarterly data

Descending order
Quarter
Houses
house
transactions
Houses
house
Price per m²
Apartments
apt.
transactions
Apartments
apt.
Price per m²
2025 Q1
1
526 
0
--- 
2024 Q4
4
2 886 
1
2 415 
2024 Q3
3
3 043 
0
--- 
2024 Q2
2
2 824 
0
--- 
2023 Q4
4
4 144 
0
--- 
2023 Q3
5
2 530 
0
--- 
2023 Q2
4
2 060 
0
--- 
2023 Q1
3
2 232 
0
--- 
2022 Q4
2
2 525 
0
--- 
2022 Q3
4
2 132 
0
--- 
2022 Q2
6
1 238 
0
--- 
2022 Q1
0
--- 
1
2 793 
2021 Q4
4
2 288 
0
--- 
2021 Q3
6
2 978 
0
--- 
2021 Q2
4
2 850 
0
--- 
2021 Q1
3
2 568 
0
--- 
2020 Q4
6
1 776 
1
2 177 
2020 Q3
3
2 105 
0
--- 
2020 Q2
4
2 580 
0
--- 
2020 Q1
4
2 392 
0
--- 
2019 Q4
8
2 480 
1
1 379 
2019 Q3
5
2 463 
0
--- 
2019 Q2
1
1 808 
0
--- 
2019 Q1
0
--- 
1
2 356 
2018 Q4
2
1 979 
0
--- 
2018 Q3
2
1 989 
0
--- 
2018 Q1
4
1 797 
0
--- 
2017 Q4
7
2 548 
0
--- 
2017 Q3
3
1 838 
0
--- 
2017 Q2
0
--- 
2
1 712 
2017 Q1
3
2 170 
1
2 000 
2016 Q4
3
2 074 
0
--- 
2016 Q3
4
2 572 
0
--- 
2016 Q2
3
1 512 
2
410 
2016 Q1
2
2 068 
0
--- 
2015 Q4
1
2 224 
1
793 
2015 Q3
7
1 583 
0
--- 
2015 Q2
3
1 467 
1
600 
2015 Q1
1
1 204 
1
918 
2014 Q4
2
2 620 
0
--- 
2014 Q3
6
2 174 
0
--- 
2014 Q2
4
1 432 
0
--- 
2014 Q1
2
1 773 
0
--- 

Rhône (69)

Most expensive cities

City
name
Descending orderHouses
house
Price per m²
5 868 
5 484 
City
name
Descending orderApartments
apt.
Price per m²
4 729 
4 719 
4 505 

Least expensive cities

City
name
Ascending orderHouses
house
Price per m²
744 
915 
1 250 
1 260 
City
name
Ascending orderApartments
apt.
Price per m²
428 
470 
529 
593