emooki
HomePrice mapTransactions
🇬🇧 English🇫🇷 Français🇩🇪 Deutsch🇪🇸 Español🇮🇹 Italiano

Real estate price map


Real estate price map in the municipality of Quincié-en-Beaujolais.

Rhône (69)
Quincié-en-Beaujolais

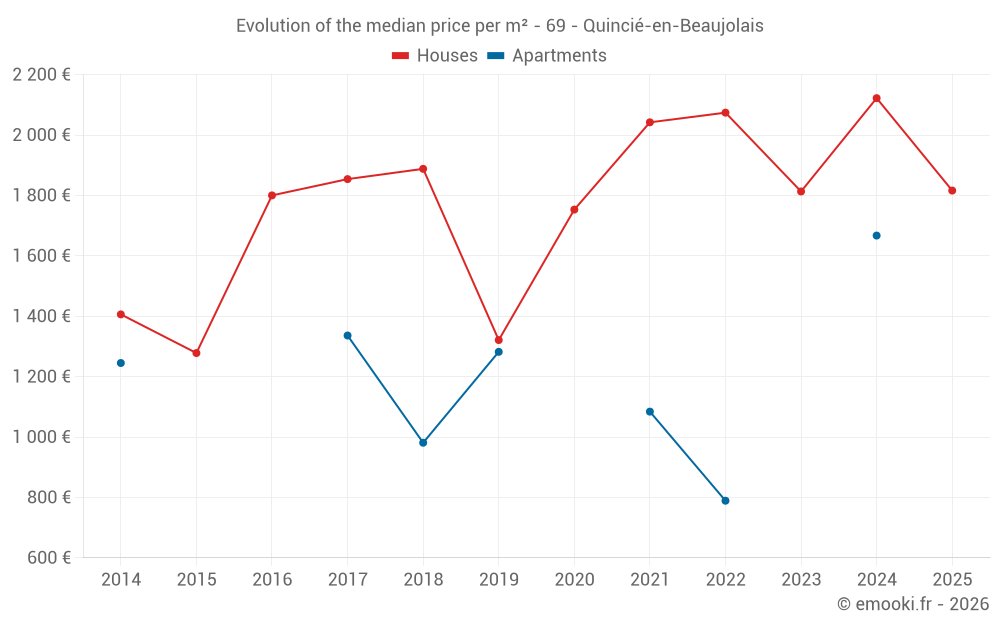
Median price of real estate
in the municipality of Quincié-en-Beaujolais

HousesHouses
1 887  /m²
1-23-45-67-89-10
Reliability 7/10
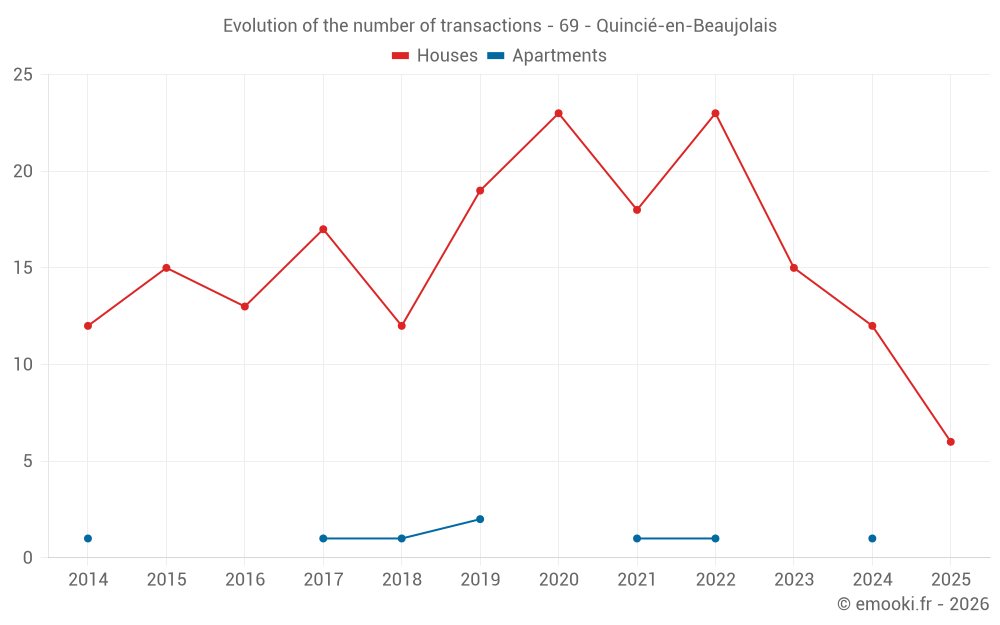
Median price on the 29 transactions of the last 24 months.
from 1 476 to
2 662  /m²
60% of transactions from the 2nd to the 8th deciles.
ApartmentsApartments
1 044  /m²
1-23-45-67-89-10
Reliability 2/10
Median price on the 6 transactions of the last 96 months.
DwellingsDwellings
1 881  /m²
1-23-45-67-89-10
Reliability 7/10
Median price on the 30 transactions of the last 24 months.
from 1 477 to
2 643  /m²
60% of transactions from the 2nd to the 8th deciles.
HousesEvolution of the price per m² of houses since...
1 year
-14%
2 years
+0.2%
3 years
-12%
4 years
-11%
5 years
+3.6%
6 years
+37%
7 years
-3.8%
8 years
-2%
9 years
+0.9%
10 years
+42%
11 years
+29%
ApartmentsEvolution of the price per m² of apartments since...
1 year
--
2 years
--
3 years
--
4 years
--
5 years
--
6 years
--
7 years
--
8 years
--
9 years
--
10 years
--
11 years
--

Yearly evolution

Evolution of the median price per m²

Evolution of the number of transactions

Warning, last year incomplete. Projections made based on the proportions between semesters of the previous year at the departmental/national level and by type of property.

Yearly data

Descending order
Year
Houses
house
transactions
Houses
house
Price per m²
Apartments
apt.
transactions
Apartments
apt.
Price per m²
2025
6
1 816 
0
--- 
2024
12
2 122 
1
1 667 
2023
15
1 813 
0
--- 
2022
23
2 074 
1
789 
2021
18
2 042 
1
1 084 
2020
23
1 753 
0
--- 
2019
19
1 321 
2
1 282 
2018
12
1 888 
1
981 
2017
17
1 854 
1
1 336 
2016
13
1 800 
0
--- 
2015
15
1 278 
0
--- 
2014
12
1 406 
1
1 245 

Analysis

Structure of prices per m²

Values of price percentiles per m² over the periods used for the estimated price of each type of property.

Structure of transaction amounts

Values of transaction amounts percentiles over the periods used for the estimated price of each type of property.

Transaction amounts and prices per m² by percentile

Ascending order
Percentile
Houses
house
Price per m²
Houses
house
Transaction amount
Apartments
apt.
Price per m²
Apartments
apt.
Transaction amount
10th percentile
1 152 
109 K
885 
90 000 
20th percentile
1 476 
134 K
981 
120 K
30th percentile
1 717 
174 K
993 
123 K
40th percentile
1 820 
199 K
1 005 
126 K
50th percentile
1 887 
222 K
1 044 
131 K
60th percentile
2 033 
246 K
1 084 
136 K
70th percentile
2 191 
275 K
1 321 
143 K
80th percentile
2 662 
337 K
1 558 
150 K
90th percentile
3 193 
414 K
1 612 
205 K

National and departmental comparison

Evolution of the median price per m² of houses

Evolution of the median price per m² of apartments

Quarterly evolution

Evolution of the median price per m²

Evolution of the number of transactions

Quarterly data

Descending order
Quarter
Houses
house
transactions
Houses
house
Price per m²
Apartments
apt.
transactions
Apartments
apt.
Price per m²
2025 Q2
3
2 026 
0
--- 
2025 Q1
3
1 229 
0
--- 
2024 Q4
4
2 343 
1
1 667 
2024 Q3
4
3 044 
0
--- 
2024 Q2
1
2 035 
0
--- 
2024 Q1
3
1 489 
0
--- 
2023 Q4
3
1 691 
0
--- 
2023 Q3
8
1 879 
0
--- 
2023 Q2
1
1 162 
0
--- 
2023 Q1
3
2 077 
0
--- 
2022 Q4
7
3 024 
0
--- 
2022 Q3
4
2 988 
0
--- 
2022 Q2
5
1 991 
0
--- 
2022 Q1
7
1 765 
1
789 
2021 Q4
6
2 044 
0
--- 
2021 Q3
5
1 966 
1
1 084 
2021 Q2
5
2 391 
0
--- 
2021 Q1
2
1 354 
0
--- 
2020 Q4
4
1 381 
0
--- 
2020 Q3
8
1 623 
0
--- 
2020 Q2
5
1 627 
0
--- 
2020 Q1
6
2 078 
0
--- 
2019 Q4
4
1 744 
1
1 558 
2019 Q3
6
1 136 
0
--- 
2019 Q2
4
1 060 
0
--- 
2019 Q1
5
1 306 
1
1 005 
2018 Q4
2
1 606 
1
981 
2018 Q3
3
1 859 
0
--- 
2018 Q2
1
2 250 
0
--- 
2018 Q1
6
2 022 
0
--- 
2017 Q4
2
1 956 
0
--- 
2017 Q3
6
1 936 
0
--- 
2017 Q2
6
1 963 
1
1 336 
2017 Q1
3
1 523 
0
--- 
2016 Q4
2
2 048 
0
--- 
2016 Q3
5
1 946 
0
--- 
2016 Q2
2
1 128 
0
--- 
2016 Q1
4
1 448 
0
--- 
2015 Q4
6
1 145 
0
--- 
2015 Q3
4
1 529 
0
--- 
2015 Q2
1
1 513 
0
--- 
2015 Q1
4
1 602 
0
--- 
2014 Q4
2
1 069 
0
--- 
2014 Q3
6
1 612 
1
1 245 
2014 Q2
2
2 149 
0
--- 
2014 Q1
2
1 372 
0
--- 

Rhône (69)

Most expensive cities

City
name
Descending orderHouses
house
Price per m²
5 868 
5 484 
City
name
Descending orderApartments
apt.
Price per m²
4 729 
4 719 
4 505 

Least expensive cities

City
name
Ascending orderHouses
house
Price per m²
744 
915 
1 250 
1 260 
City
name
Ascending orderApartments
apt.
Price per m²
428 
470 
529 
593