emooki
HomePrice mapTransactions
🇬🇧 English🇫🇷 Français🇩🇪 Deutsch🇪🇸 Español🇮🇹 Italiano

Real estate price map


Real estate price map in the municipality of Millery, choose a section to see transactions by parcel.

Rhône (69)

Millery - Real estate price m²

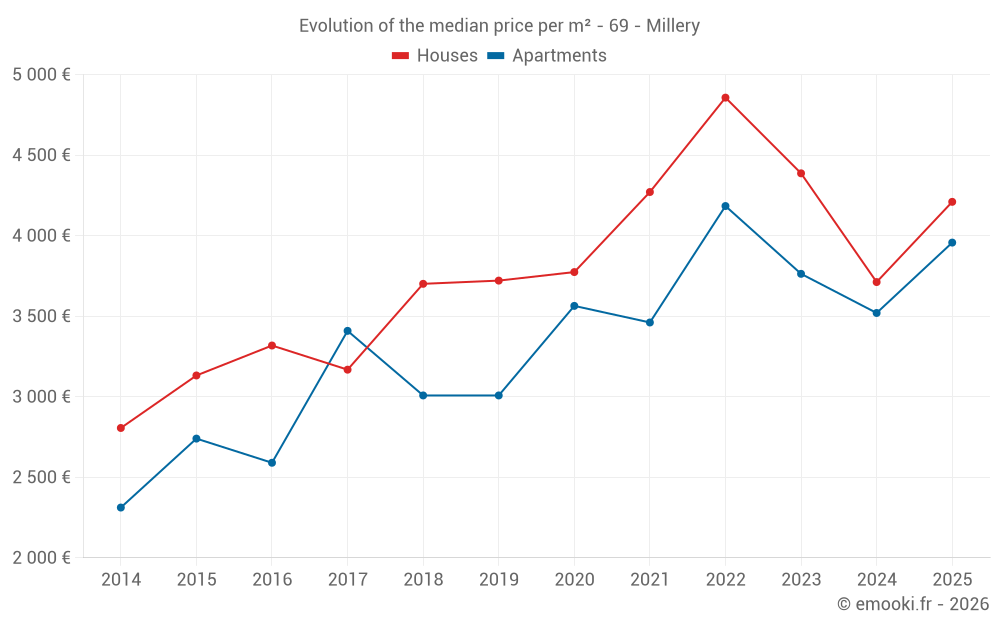
Median price of real estate
in the municipality of Millery

HousesHouses
3 898  /m²
1-23-45-67-89-10
Reliability 8/10
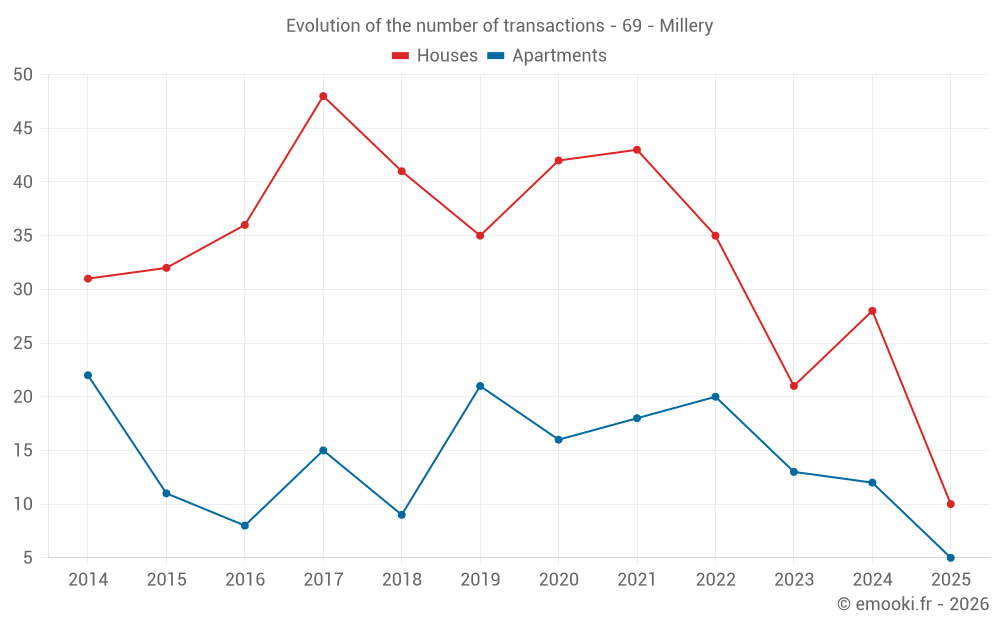
Median price on the 21 transactions of the last 12 months.
from 3 000 to
4 639  /m²
60% of transactions from the 2nd to the 8th deciles.
ApartmentsApartments
3 719  /m²
1-23-45-67-89-10
Reliability 7/10
Median price on the 24 transactions of the last 24 months.
from 3 158 to
4 438  /m²
60% of transactions from the 2nd to the 8th deciles.
DwellingsDwellings
3 898  /m²
1-23-45-67-89-10
Reliability 8/10
Median price on the 29 transactions of the last 12 months.
from 3 077 to
4 600  /m²
60% of transactions from the 2nd to the 8th deciles.
HousesEvolution of the price per m² of houses since...
1 year
+13%
2 years
-4%
3 years
-13%
4 years
-1.4%
5 years
+12%
6 years
+13%
7 years
+14%
8 years
+33%
9 years
+27%
10 years
+34%
11 years
+50%
The price per m² of houses has decreased by 13% since 3 years, but it has increased by 50% in 11 years.
ApartmentsEvolution of the price per m² of apartments since...
1 year
+12%
2 years
+5.2%
3 years
-5.4%
4 years
+14%
5 years
+11%
6 years
+32%
7 years
+32%
8 years
+16%
9 years
+53%
10 years
+44%
11 years
+71%
The price per m² of apartments has decreased by 5.4% since 3 years, but it has increased by 71% in 11 years.

Yearly evolution

Evolution of the median price per m²

Evolution of the median price per m² - 69 - Millery

Evolution of the number of transactions

Warning, last year incomplete. Projections made based on the proportions between semesters of the previous year at the departmental/national level and by type of property.

Evolution of the number of transactions - 69 - Millery

Yearly data

Descending order
Year
Houses
house
transactions
Houses
house
Price per m²
Apartments
apt.
transactions
Apartments
apt.
Price per m²
2025
10
4 210 
5
3 957 
2024
28
3 712 
12
3 520 
2023
21
4 387 
13
3 763 
2022
35
4 857 
20
4 184 
2021
43
4 271 
18
3 461 
2020
42
3 774 
16
3 564 
2019
35
3 721 
21
3 008 
2018
41
3 701 
9
3 008 
2017
48
3 168 
15
3 409 
2016
36
3 318 
8
2 590 
2015
32
3 132 
11
2 740 
2014
31
2 806 
22
2 312 

Analysis

Structure of prices per m²

Values of price percentiles per m² over the periods used for the estimated price of each type of property.

Structure of transaction amounts

Values of transaction amounts percentiles over the periods used for the estimated price of each type of property.

Transaction amounts and prices per m² by percentile

Ascending order
Percentile
Houses
house
Price per m²
Houses
house
Transaction amount
Apartments
apt.
Price per m²
Apartments
apt.
Transaction amount
10th percentile
2 428 
321 K
2 845 
169 K
20th percentile
3 000 
336 K
3 158 
175 K
30th percentile
3 692 
360 K
3 251 
190 K
40th percentile
3 816 
429 K
3 596 
197 K
50th percentile
3 898 
460 K
3 719 
213 K
60th percentile
4 223 
483 K
3 991 
249 K
70th percentile
4 435 
530 K
4 180 
291 K
80th percentile
4 639 
550 K
4 438 
327 K
90th percentile
4 902 
588 K
4 595 
394 K

National and departmental comparison

Evolution of the median price per m² of houses

Evolution of the median price per m² of apartments

Quarterly evolution

Evolution of the median price per m²

Evolution of the number of transactions

Quarterly data

Descending order
Quarter
Houses
house
transactions
Houses
house
Price per m²
Apartments
apt.
transactions
Apartments
apt.
Price per m²
2025 Q2
2
4 416 
1
4 362 
2025 Q1
8
4 046 
4
3 832 
2024 Q4
4
3 795 
2
3 729 
2024 Q3
7
3 816 
1
3 583 
2024 Q2
9
3 895 
4
3 056 
2024 Q1
8
3 349 
5
4 172 
2023 Q4
3
3 000 
2
3 638 
2023 Q3
6
4 694 
5
3 730 
2023 Q2
5
2 769 
1
3 763 
2023 Q1
7
5 439 
5
4 241 
2022 Q4
12
4 620 
6
4 698 
2022 Q3
9
4 602 
4
4 544 
2022 Q2
8
5 584 
6
4 034 
2022 Q1
6
5 096 
4
3 032 
2021 Q4
12
4 854 
5
3 495 
2021 Q3
14
4 808 
4
3 218 
2021 Q2
8
3 800 
6
3 401 
2021 Q1
9
3 699 
3
4 000 
2020 Q4
10
3 812 
3
4 268 
2020 Q3
12
3 544 
3
3 712 
2020 Q2
4
4 310 
5
3 038 
2020 Q1
16
3 572 
5
3 653 
2019 Q4
8
3 392 
4
2 653 
2019 Q3
12
3 636 
7
3 008 
2019 Q2
7
4 563 
4
3 178 
2019 Q1
8
3 614 
6
3 240 
2018 Q4
7
3 872 
1
2 620 
2018 Q3
9
3 895 
5
3 008 
2018 Q2
15
3 422 
2
2 877 
2018 Q1
10
3 618 
1
3 203 
2017 Q4
15
3 124 
3
2 561 
2017 Q3
14
3 586 
3
3 590 
2017 Q2
13
3 108 
5
3 464 
2017 Q1
6
3 205 
4
3 190 
2016 Q4
9
2 894 
3
3 220 
2016 Q3
12
3 264 
2
2 428 
2016 Q2
11
3 758 
1
3 073 
2016 Q1
4
3 601 
2
2 530 
2015 Q4
5
3 181 
4
2 626 
2015 Q3
13
3 013 
1
2 826 
2015 Q2
6
3 132 
2
2 206 
2015 Q1
8
2 798 
4
2 469 
2014 Q4
5
3 248 
4
1 828 
2014 Q3
13
3 274 
6
3 254 
2014 Q2
5
2 531 
7
2 331 
2014 Q1
8
2 376 
5
1 462 

Overview of the latest real estate transactions

The following list is an anonymized overview of the latest transactions. For more details and to find all transactions, please use the map to view transactions by plot or the transaction search page for a search by criteria.

2025-06-25
10 072 
Sale
Land
4675 m2
-Vergers
Land
5397 m2
-Taillis simples
2025-05-28
1 
Sale
Land
87 m2
-Terres
2025-05-28
11 000 
Sale
Land
8475 m2
-Terres
Land
24 m2
-Sols
2025-05-27
205 000 
4 362  /m²(47 m²)
Sale
Apartments
Apartment
2 rooms
47 m2
1 outbuilding
2025-05-22
1 
Sale
Land
50 m2
-Sols
2025-05-19
550 000 
4 198  /m²(131 m²)
Sale
Houses
House
4 rooms
131 m2
Land
456 m2
-Sols
Land
80 m2
-Vignes
2025-04-14
593 100 
4 634  /m²(128 m²)
Sale
Houses
House
4 rooms
128 m2
2 outbuildings
Land
935 m2
-Sols
2025-03-28
530 000 
3 869  /m²(137 m²)
Sale
Houses
House
6 rooms
137 m2
1 outbuilding
Land
1131 m2
-Sols
Land
638 m2
-Sols
2025-03-26
550 000 
4 435  /m²(124 m²)
Sale
Houses
House
4 rooms
124 m2
1 outbuilding
Land
624 m2
-Sols
2025-03-26
303 550 
2 428  /m²(125 m²)
Sale
Houses
House
4 rooms
125 m2
Land
84 m2
-Sols
2025-03-26
670 000 
833  /m²(804 m²)
Sale
Commercial property
804 m2
Land
2000 m2
-Sols
2025-03-25
1 110 
Sale
Land
37 m2
-Sols
2025-03-24
201 400 
4 577  /m²(44 m²)
Sale
Apartments
Apartment
2 rooms
44 m2
1 outbuilding
2025-03-17
189 950 
3 957  /m²(48 m²)
Sale
Apartments
Apartment
2 rooms
48 m2
1 outbuilding
2025-03-13
302 500 
3 087  /m²(98 m²)
Sale
Apartments
Apartment
3 rooms
98 m2
2 outbuildings
2025-03-13
430 000 
3 772  /m²(114 m²)
Sale
Houses
House
5 rooms
114 m2
2025-02-28
522 950 
2 724  /m²(192 m²)
Sale
Houses
House
5 rooms
192 m2
1 outbuilding
Land
171 m2
-Sols
2025-02-27
395 900 
4 658  /m²(85 m²)
Sale
Land
927 m2
-Terrains d'agrément
/Parc
Houses
House
5 rooms
85 m2
2 outbuildings
Land
440 m2
-Sols
2025-02-21
445 000 
3 708  /m²(120 m²)
Sale
Apartments
Apartment
4 rooms
120 m2
1 outbuilding
1 outbuilding
2025-02-20
2 472 
Sale
Land
2472 m2
-Terres
889 transactions listed in the municipality

Rhône (69)

Most expensive cities

City
name
Descending orderHouses
house
Price per m²
5 868 
5 484 
City
name
Descending orderApartments
apt.
Price per m²
4 729 
4 719 
4 505 

Least expensive cities

City
name
Ascending orderHouses
house
Price per m²
744 
915 
1 250 
1 260 
City
name
Ascending orderApartments
apt.
Price per m²
428 
470 
529 
593