emooki
HomePrice mapTransactions
🇬🇧 English🇫🇷 Français🇩🇪 Deutsch🇪🇸 Español🇮🇹 Italiano

Real estate price map


Real estate price map in the municipality of Haute-Rivoire, choose a section to see transactions by parcel.

Rhône (69)

Haute-Rivoire - Real estate price m²

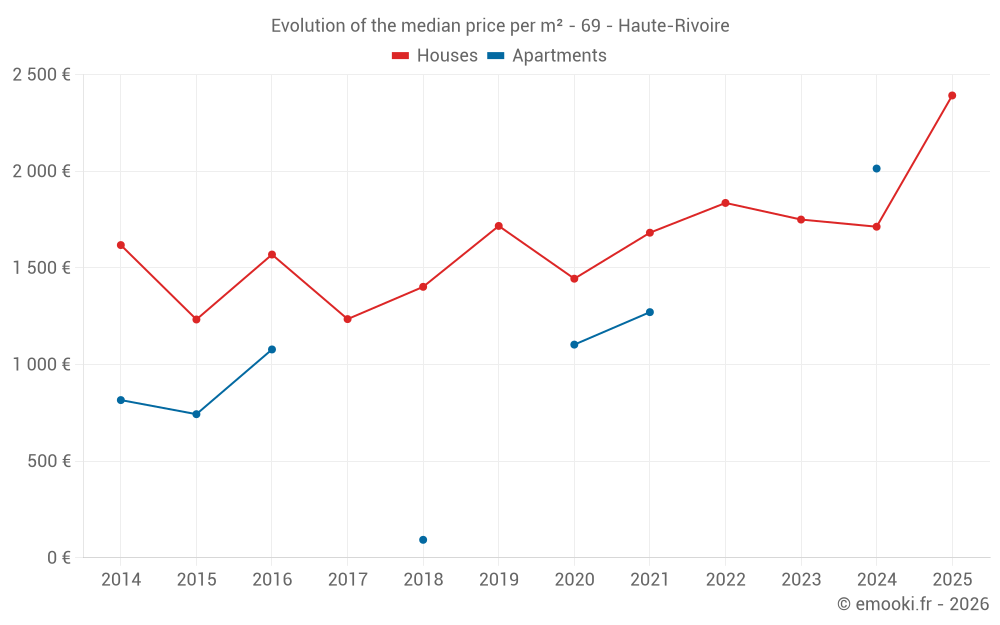
Median price of real estate
in the municipality of Haute-Rivoire

HousesHouses
1 793  /m²
1-23-45-67-89-10
Reliability 7/10
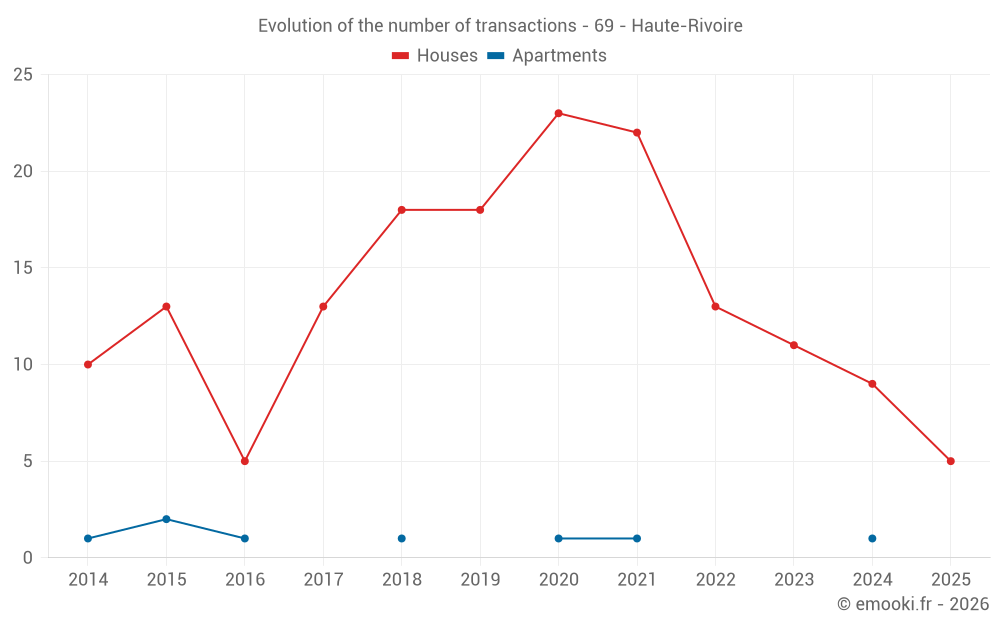
Median price on the 20 transactions of the last 24 months.
from 1 396 to
2 422  /m²
60% of transactions from the 2nd to the 8th deciles.
ApartmentsApartments
1 187  /m²
1-23-45-67-89-10
Reliability 2/10
Median price on the 4 transactions of the last 96 months.
DwellingsDwellings
1 873  /m²
1-23-45-67-89-10
Reliability 7/10
Median price on the 21 transactions of the last 24 months.
from 1 408 to
2 392  /m²
60% of transactions from the 2nd to the 8th deciles.
HousesEvolution of the price per m² of houses since...
1 year
+40%
2 years
+37%
3 years
+30%
4 years
+42%
5 years
+66%
6 years
+39%
7 years
+71%
8 years
+94%
9 years
+52%
10 years
+94%
11 years
+48%

Yearly evolution

Evolution of the median price per m²

Evolution of the median price per m² - 69 - Haute-Rivoire

Evolution of the number of transactions

Warning, last year incomplete. Projections made based on the proportions between semesters of the previous year at the departmental/national level and by type of property.

Evolution of the number of transactions - 69 - Haute-Rivoire

Yearly data

Descending order
Year
Houses
house
transactions
Houses
house
Price per m²
Apartments
apt.
transactions
Apartments
apt.
Price per m²
2025
5
2 392 
0
--- 
2024
9
1 713 
1
2 014 
2023
11
1 750 
0
--- 
2022
13
1 836 
0
--- 
2021
22
1 682 
1
1 271 
2020
23
1 444 
1
1 103 
2019
18
1 717 
0
--- 
2018
18
1 402 
1
93 
2017
13
1 235 
0
--- 
2016
5
1 569 
1
1 078 
2015
13
1 233 
2
743 
2014
10
1 618 
1
816 

Analysis

Structure of prices per m²

Values of price percentiles per m² over the periods used for the estimated price of each type of property.

Structure of transaction amounts

Values of transaction amounts percentiles over the periods used for the estimated price of each type of property.

Transaction amounts and prices per m² by percentile

Ascending order
Percentile
Houses
house
Price per m²
Houses
house
Transaction amount
Apartments
apt.
Price per m²
Apartments
apt.
Transaction amount
10th percentile
1 315 
138 K
396 
115 K
20th percentile
1 396 
174 K
699 
131 K
30th percentile
1 435 
189 K
1 002 
148 K
40th percentile
1 601 
196 K
1 137 
155 K
50th percentile
1 793 
217 K
1 187 
157 K
60th percentile
2 101 
228 K
1 237 
159 K
70th percentile
2 167 
248 K
1 345 
172 K
80th percentile
2 422 
270 K
1 568 
208 K
90th percentile
2 636 
305 K
1 791 
244 K

National and departmental comparison

Evolution of the median price per m² of houses

Evolution of the median price per m² of apartments

Quarterly evolution

Evolution of the median price per m²

Evolution of the number of transactions

Quarterly data

Descending order
Quarter
Houses
house
transactions
Houses
house
Price per m²
Apartments
apt.
transactions
Apartments
apt.
Price per m²
2025 Q1
5
2 392 
0
--- 
2024 Q4
1
1 713 
1
2 014 
2024 Q3
3
1 414 
0
--- 
2024 Q2
3
2 095 
0
--- 
2024 Q1
2
1 802 
0
--- 
2023 Q4
2
2 165 
0
--- 
2023 Q3
4
1 918 
0
--- 
2023 Q2
1
1 939 
0
--- 
2023 Q1
4
1 650 
0
--- 
2022 Q4
6
2 324 
0
--- 
2022 Q3
2
1 869 
0
--- 
2022 Q2
2
1 733 
0
--- 
2022 Q1
3
1 707 
0
--- 
2021 Q4
5
1 475 
0
--- 
2021 Q3
6
1 883 
0
--- 
2021 Q2
6
1 435 
1
1 271 
2021 Q1
5
985 
0
--- 
2020 Q4
5
1 444 
0
--- 
2020 Q3
6
1 706 
0
--- 
2020 Q2
6
1 820 
1
1 103 
2020 Q1
6
1 225 
0
--- 
2019 Q4
4
1 851 
0
--- 
2019 Q3
5
974 
0
--- 
2019 Q2
6
1 720 
0
--- 
2019 Q1
3
2 136 
0
--- 
2018 Q4
3
1 255 
1
93 
2018 Q3
7
1 873 
0
--- 
2018 Q2
4
780 
0
--- 
2018 Q1
4
789 
0
--- 
2017 Q4
2
1 230 
0
--- 
2017 Q3
5
1 067 
0
--- 
2017 Q2
3
1 235 
0
--- 
2017 Q1
3
1 806 
0
--- 
2016 Q4
2
1 306 
0
--- 
2016 Q3
2
1 832 
1
1 078 
2016 Q1
1
1 569 
0
--- 
2015 Q4
8
1 132 
0
--- 
2015 Q3
3
1 236 
1
412 
2015 Q1
2
928 
1
1 074 
2014 Q4
2
1 470 
0
--- 
2014 Q3
2
2 102 
1
816 
2014 Q2
2
1 329 
0
--- 
2014 Q1
4
1 951 
0
--- 

Overview of the latest real estate transactions

The following list is an anonymized overview of the latest transactions. For more details and to find all transactions, please use the map to view transactions by plot or the transaction search page for a search by criteria.

2025-06-11
3 663 
Sale
Land
12210 m2
-Prés
2025-06-05
1 500 
Sale
Land
3414 m2
-Prés
2025-05-28
32 000 
Sale
Land
2710 m2
-Prés
Land
14005 m2
-Prés
Land
11154 m2
-Prés
Land
22308 m2
-Prés
Land
7804 m2
-Prés
2025-04-04
6 000 
Sale
Land
3512 m2
-Terres
2025-03-20
232 000 
2 392  /m²(97 m²)
Sale
Houses
House
4 rooms
97 m2
Land
644 m2
-Sols
2025-02-21
138 600 
1 295  /m²(107 m²)
Sale
Houses
House
4 rooms
107 m2
Land
334 m2
-Sols
2025-02-17
303 900 
2 643  /m²(115 m²)
Sale
Houses
House
4 rooms
115 m2
Land
500 m2
-Sols
Land
1000 m2
-Jardins
2025-02-12
256 650 
2 541  /m²(101 m²)
Sale
Houses
House
4 rooms
101 m2
Land
1144 m2
-Jardins
Land
856 m2
-Sols
2025-01-22
183 000 
1 408  /m²(130 m²)
Sale
Houses
House
5 rooms
130 m2
1 outbuilding
2025-01-17
360 
Sale
Land
2400 m2
-Taillis simples
2024-12-26
36 000 
Sale
Land
1000 m2
-Sols
2024-12-20
55 000 
Sale
Land
740 m2
-Jardins
2024-11-27
1 
Sale
Land
141 m2
-Sols
2024-11-27
47 530 
Sale
Land
2341 m2
-Sols
Land
2412 m2
-Prés
2024-11-13
280 000 
2 014  /m²(139 m²)
Sale
Apartments
Apartment
4 rooms
101 m2
Apartments
Apartment
2 rooms
38 m2
1 outbuilding
Land
1284 m2
-Jardins
Land
716 m2
-Sols
2024-11-12
50 000 
Sale
Land
2000 m2
-Sols
Land
11600 m2
-Prés
2024-11-08
2 000 
Sale
Land
5222 m2
-Prés
2024-11-08
677 
Sale
Land
2071 m2
-Prés
Land
184 m2
-Sols
2024-10-22
1 800 
Sale
Land
275 m2
-Jardins
Land
34 m2
-Sols
2024-10-11
197 000 
1 713  /m²(115 m²)
Sale
Houses
House
5 rooms
115 m2
1 outbuilding
Land
1023 m2
-Sols
377 transactions listed in the municipality

Rhône (69)

Most expensive cities

City
name
Descending orderHouses
house
Price per m²
5 868 
5 484 
City
name
Descending orderApartments
apt.
Price per m²
4 729 
4 719 
4 505 

Least expensive cities

City
name
Ascending orderHouses
house
Price per m²
744 
915 
1 250 
1 260 
City
name
Ascending orderApartments
apt.
Price per m²
428 
470 
529 
593