emooki
HomePrice mapTransactions
🇬🇧 English🇫🇷 Français🇩🇪 Deutsch🇪🇸 Español🇮🇹 Italiano

Real estate price map


Real estate price map in the municipality of Fontaines-sur-Saône.

Rhône (69)
Fontaines-sur-Saône

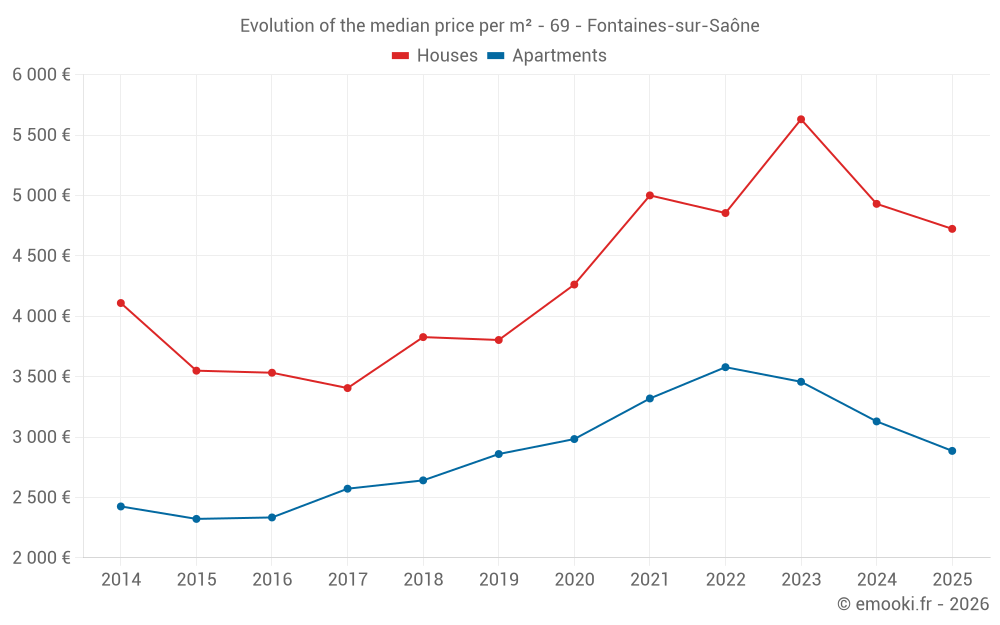
Median price of real estate
in the municipality of Fontaines-sur-Saône

HousesHouses
5 063  /m²
1-23-45-67-89-10
Reliability 7/10
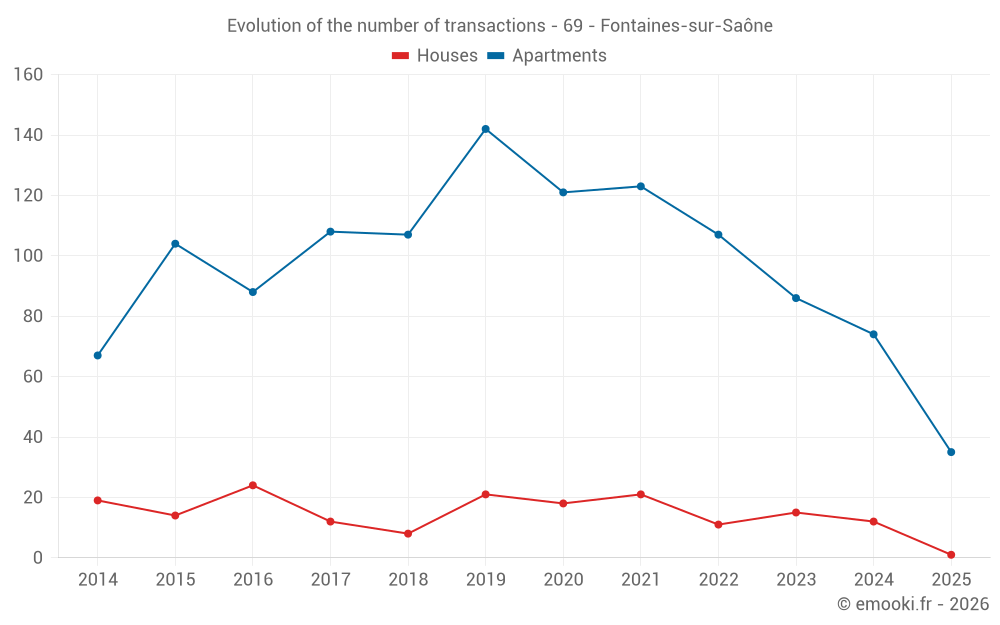
Median price on the 24 transactions of the last 24 months.
from 4 546 to
6 575  /m²
60% of transactions from the 2nd to the 8th deciles.
ApartmentsApartments
2 885  /m²
1-23-45-67-89-10
Reliability 9/10
Median price on the 35 transactions of the last 6 months.
from 2 422 to
4 028  /m²
60% of transactions from the 2nd to the 8th deciles.
DwellingsDwellings
2 936  /m²
1-23-45-67-89-10
Reliability 9/10
Median price on the 36 transactions of the last 6 months.
from 2 424 to
4 030  /m²
60% of transactions from the 2nd to the 8th deciles.
HousesEvolution of the price per m² of houses since...
1 year
--
2 years
--
3 years
--
4 years
--
5 years
--
6 years
--
7 years
--
8 years
--
9 years
--
10 years
--
11 years
--
ApartmentsEvolution of the price per m² of apartments since...
1 year
-7.8%
2 years
-17%
3 years
-19%
4 years
-13%
5 years
-3.3%
6 years
+0.9%
7 years
+9.2%
8 years
+12%
9 years
+24%
10 years
+24%
11 years
+19%

Yearly evolution

Evolution of the median price per m²

Evolution of the number of transactions

Warning, last year incomplete. Projections made based on the proportions between semesters of the previous year at the departmental/national level and by type of property.

Yearly data

Descending order
Year
Houses
house
transactions
Houses
house
Price per m²
Apartments
apt.
transactions
Apartments
apt.
Price per m²
2025
1
4 723 
35
2 885 
2024
12
4 930 
74
3 129 
2023
15
5 630 
86
3 457 
2022
11
4 854 
107
3 578 
2021
21
5 000 
123
3 319 
2020
18
4 262 
121
2 983 
2019
21
3 803 
142
2 859 
2018
8
3 827 
107
2 641 
2017
12
3 405 
108
2 572 
2016
24
3 532 
88
2 334 
2015
14
3 549 
104
2 322 
2014
19
4 109 
67
2 425 

Analysis

Structure of prices per m²

Values of price percentiles per m² over the periods used for the estimated price of each type of property.

Structure of transaction amounts

Values of transaction amounts percentiles over the periods used for the estimated price of each type of property.

Transaction amounts and prices per m² by percentile

Ascending order
Percentile
Houses
house
Price per m²
Houses
house
Transaction amount
Apartments
apt.
Price per m²
Apartments
apt.
Transaction amount
10th percentile
3 846 
290 K
2 254 
116 K
20th percentile
4 546 
365 K
2 422 
160 K
30th percentile
4 667 
460 K
2 616 
171 K
40th percentile
4 912 
492 K
2 763 
193 K
50th percentile
5 063 
520 K
2 885 
212 K
60th percentile
5 530 
580 K
3 084 
227 K
70th percentile
6 135 
689 K
3 627 
254 K
80th percentile
6 575 
764 K
4 028 
303 K
90th percentile
7 550 
873 K
4 092 
517 K

National and departmental comparison

Evolution of the median price per m² of houses

Evolution of the median price per m² of apartments

Quarterly evolution

Evolution of the median price per m²

Evolution of the number of transactions

Quarterly data

Descending order
Quarter
Houses
house
transactions
Houses
house
Price per m²
Apartments
apt.
transactions
Apartments
apt.
Price per m²
2025 Q2
1
4 723 
15
2 986 
2025 Q1
0
--- 
20
2 866 
2024 Q4
5
4 547 
25
3 125 
2024 Q3
3
5 126 
20
3 344 
2024 Q2
1
4 900 
17
3 102 
2024 Q1
3
5 751 
12
3 116 
2023 Q4
6
5 864 
15
3 438 
2023 Q3
5
6 471 
23
3 294 
2023 Q2
3
5 466 
24
3 716 
2023 Q1
1
4 027 
24
3 518 
2022 Q4
4
4 601 
27
3 629 
2022 Q3
2
4 559 
32
3 726 
2022 Q2
3
4 437 
21
3 306 
2022 Q1
2
5 172 
27
3 835 
2021 Q4
4
4 200 
20
3 276 
2021 Q3
7
5 086 
46
3 224 
2021 Q2
8
5 502 
33
3 374 
2021 Q1
2
2 694 
24
3 445 
2020 Q4
5
3 764 
37
3 000 
2020 Q3
5
4 721 
35
3 173 
2020 Q2
3
3 981 
20
2 712 
2020 Q1
5
4 134 
29
3 014 
2019 Q4
4
5 004 
35
2 885 
2019 Q3
3
3 244 
41
3 015 
2019 Q2
8
3 596 
39
2 726 
2019 Q1
6
4 482 
27
2 863 
2018 Q4
3
5 200 
27
2 606 
2018 Q3
2
2 200 
33
2 870 
2018 Q2
2
4 573 
28
2 664 
2018 Q1
1
3 141 
19
2 282 
2017 Q4
1
4 144 
18
2 694 
2017 Q3
6
3 272 
32
2 784 
2017 Q2
1
2 893 
28
2 400 
2017 Q1
4
4 513 
30
2 354 
2016 Q4
3
3 457 
24
2 403 
2016 Q3
14
3 678 
22
2 396 
2016 Q2
4
3 436 
25
2 400 
2016 Q1
3
3 047 
17
2 145 
2015 Q4
3
3 915 
37
2 429 
2015 Q3
4
3 736 
29
2 292 
2015 Q2
4
3 094 
26
2 208 
2015 Q1
3
3 579 
12
2 146 
2014 Q4
3
4 283 
19
2 326 
2014 Q3
10
4 007 
16
2 228 
2014 Q2
1
5 439 
11
2 686 
2014 Q1
5
3 680 
21
2 563 

Rhône (69)

Most expensive cities

City
name
Descending orderHouses
house
Price per m²
5 868 
5 484 
City
name
Descending orderApartments
apt.
Price per m²
4 729 
4 719 
4 505 

Least expensive cities

City
name
Ascending orderHouses
house
Price per m²
744 
915 
1 250 
1 260 
City
name
Ascending orderApartments
apt.
Price per m²
428 
470 
529 
593