Real estate price map
Real estate price map in the municipality of Lourches, choose a section to see transactions by parcel.
Nord (59)
Price per m² in Lourches
Median price of real estate
in the municipality of Lourches
Houses
956 € /m²
Reliability 9/10
Median price on the 25 transactions of the last 6 months.
from 806 to
1 332 € /m²
1 332 € /m²
60% of transactions from the 2nd to the 8th deciles.
Apartments
1 024 € /m²
Reliability 2/10
Median price on the 6 transactions of the last 96 months.
Dwellings
968 € /m²
Reliability 9/10
Median price on the 26 transactions of the last 6 months.
from 814 to
1 331 € /m²
1 331 € /m²
60% of transactions from the 2nd to the 8th deciles.
Evolution of the price per m² of houses since...
1 year
+10%
2 years
-8.4%
3 years
+4.5%
4 years
-11%
5 years
+1.6%
6 years
-3.9%
7 years
+8.2%
8 years
+8.9%
9 years
+10%
10 years
-0.6%
11 years
+11%
The price per m² of houses has decreased by 11% since 4 years, but it has increased by 11% in 11 years.
497 transactions listed in the municipality
Yearly data
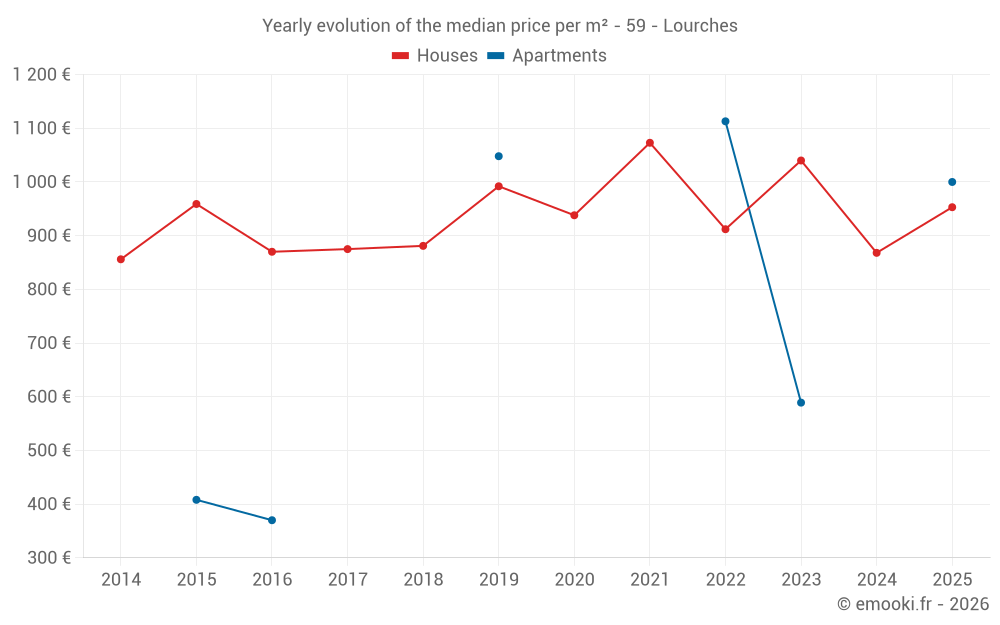
Yearly evolution of the median price per m²
Yearly evolution of the number of transactions

Yearly table
Year
house
transactions
transactions
house
Price per m²
Price per m²
apt.
transactions
transactions
apt.
Price per m²
Price per m²
2025
28
953 €
1
1 000 €
2024
38
868 €
0
--- €
2023
33
1 040 €
3
589 €
2022
32
912 €
1
1 113 €
2021
54
1 073 €
0
--- €
2020
44
938 €
0
--- €
2019
22
992 €
1
1 048 €
2018
31
881 €
0
--- €
2017
30
875 €
0
--- €
2016
23
870 €
1
370 €
2015
17
959 €
1
408 €
2014
27
856 €
0
--- €
Analysis
Structure of prices per m²
Values of price percentiles per m² over the periods used for the estimated price of each type of property.
Structure of transaction amounts
Values of transaction amounts percentiles over the periods used for the estimated price of each type of property.
Transaction amounts and prices per m² by percentile
Percentile
house
Price per m²
Price per m²
house
Transaction amount
Transaction amount
apt.
Price per m²
Price per m²
apt.
Transaction amount
Transaction amount
10th percentile
573 €
50 000 €
466 €
40 000 €
20th percentile
806 €
55 800 €
589 €
60 000 €
30th percentile
901 €
68 381 €
794 €
62 500 €
40th percentile
938 €
70 000 €
1 000 €
65 000 €
50th percentile
956 €
76 000 €
1 024 €
67 000 €
60th percentile
1 064 €
89 240 €
1 048 €
69 000 €
70th percentile
1 288 €
97 020 €
1 080 €
97 250 €
80th percentile
1 332 €
109 K€
1 113 €
126 K€
90th percentile
1 383 €
185 K€
1 192 €
160 K€
National and departmental comparison
Evolution of the median price per m² of houses
Evolution of the median price per m² of apartments
Quarterly data
Quarterly evolution of the median price per m²
Quarterly evolution of the number of transactions
Quarterly table
Quarter
house
transactions
transactions
house
Price per m²
Price per m²
apt.
transactions
transactions
apt.
Price per m²
Price per m²
2025 Q4
10
970 €
0
--- €
2025 Q3
15
956 €
1
1 000 €
2025 Q2
2
936 €
0
--- €
2025 Q1
1
523 €
0
--- €
2024 Q4
9
1 042 €
0
--- €
2024 Q3
10
762 €
0
--- €
2024 Q2
9
658 €
0
--- €
2024 Q1
10
908 €
0
--- €
2023 Q4
9
903 €
2
807 €
2023 Q3
7
958 €
1
589 €
2023 Q2
8
1 080 €
0
--- €
2023 Q1
9
1 266 €
0
--- €
2022 Q4
9
917 €
0
--- €
2022 Q3
7
1 242 €
0
--- €
2022 Q2
4
972 €
0
--- €
2022 Q1
12
896 €
1
1 113 €
2021 Q4
11
912 €
0
--- €
2021 Q3
20
1 162 €
0
--- €
2021 Q2
10
1 138 €
0
--- €
2021 Q1
13
933 €
0
--- €
2020 Q4
14
882 €
0
--- €
2020 Q3
6
870 €
0
--- €
2020 Q2
9
1 059 €
0
--- €
2020 Q1
15
954 €
0
--- €
2019 Q4
6
811 €
1
1 048 €
2019 Q3
5
1 194 €
0
--- €
2019 Q2
5
928 €
0
--- €
2019 Q1
6
996 €
0
--- €
2018 Q4
5
891 €
0
--- €
2018 Q3
12
804 €
0
--- €
2018 Q2
9
891 €
0
--- €
2018 Q1
5
722 €
0
--- €
2017 Q4
3
537 €
0
--- €
2017 Q3
6
891 €
0
--- €
2017 Q2
11
860 €
0
--- €
2017 Q1
10
900 €
0
--- €
2016 Q4
8
466 €
0
--- €
2016 Q3
6
957 €
1
370 €
2016 Q2
6
904 €
0
--- €
2016 Q1
3
642 €
0
--- €
2015 Q4
1
1 278 €
0
--- €
2015 Q3
5
1 053 €
0
--- €
2015 Q2
7
888 €
0
--- €
2015 Q1
4
1 336 €
1
408 €
2014 Q4
6
877 €
0
--- €
2014 Q3
4
692 €
0
--- €
2014 Q2
13
632 €
0
--- €
2014 Q1
4
1 254 €
0
--- €
Key takeaways
What is the price per m2 of houses in Lourches?
The median price on the 25 house transactions of the last 6 months in the municipality of Lourches was 956 € per square meter for a median property value of 76 000 €. Over this period, 60% of transactions were between 806 and 1 332 € per square meter (from the 2nd to the 8th deciles).
Compare with neighboring municipalities
City
name
name
house
Price per m²
Price per m²
apt.
Price per m²
Price per m²
City information
Zip code
- 59156 LOURCHES