Real estate price map
Real estate price map in the municipality of Fourmies, choose a section to see transactions by parcel.
Nord (59)
Price per m² in Fourmies
Median price of real estate
in the municipality of Fourmies
Houses
1 043 € /m²
Reliability 10/10
Median price on the 37 transactions of the last 3 months.
from 673 to
1 560 € /m²
1 560 € /m²
60% of transactions from the 2nd to the 8th deciles.
Apartments
762 € /m²
Reliability 6/10
Median price on the 18 transactions of the last 36 months.
from 528 to
994 € /m²
994 € /m²
60% of transactions from the 2nd to the 8th deciles.
Dwellings
972 € /m²
Reliability 10/10
Median price on the 41 transactions of the last 3 months.
from 595 to
1 500 € /m²
1 500 € /m²
60% of transactions from the 2nd to the 8th deciles.
Evolution of the price per m² of houses since...
1 year
-5.8%
2 years
-5.8%
3 years
+1.6%
4 years
-0.9%
5 years
+9.1%
6 years
+16%
7 years
+17%
8 years
+11%
9 years
+11%
10 years
+27%
11 years
+4.2%
The price per m² of houses has decreased by 5.8% since 1 year, but it has increased by 27% in 10 years.
Evolution of the price per m² of apartments since...
1 year
--
2 years
+7.6%
3 years
+5.5%
4 years
+38%
5 years
+39%
6 years
+8.5%
7 years
+16%
8 years
+3.4%
9 years
+95%
10 years
+74%
11 years
+42%
1893 transactions listed in the municipality
Yearly data
Yearly evolution of the median price per m²

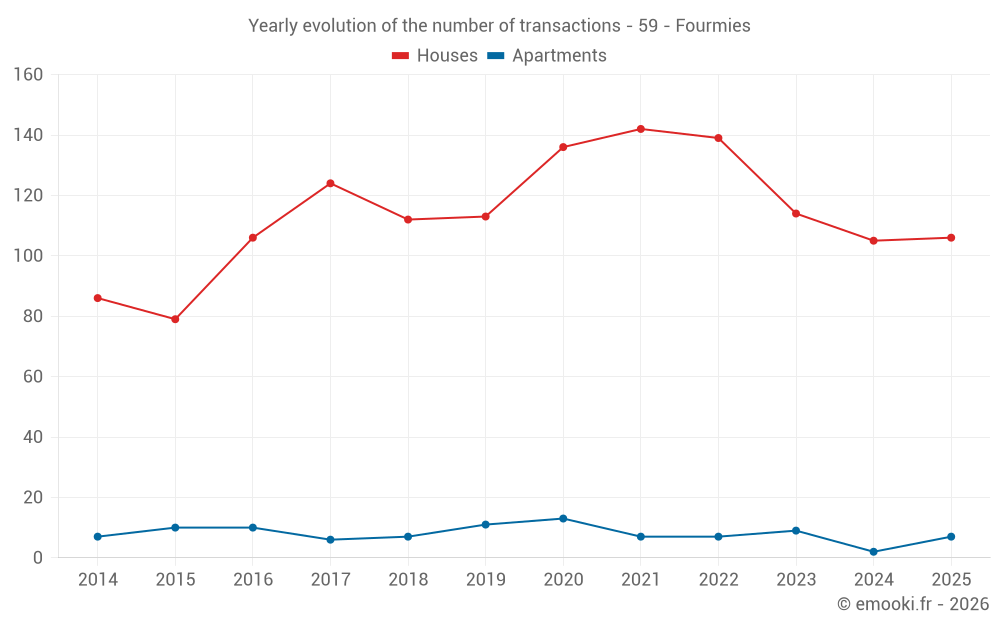
Yearly evolution of the number of transactions
Yearly table
Year
house
transactions
transactions
house
Price per m²
Price per m²
apt.
transactions
transactions
apt.
Price per m²
Price per m²
2025
106
957 €
7
753 €
2024
105
1 016 €
2
1 069 €
2023
114
1 016 €
9
700 €
2022
139
942 €
7
714 €
2021
142
966 €
7
547 €
2020
136
877 €
13
543 €
2019
113
824 €
11
694 €
2018
112
820 €
7
647 €
2017
124
862 €
6
728 €
2016
106
860 €
10
386 €
2015
79
753 €
10
434 €
2014
86
918 €
7
532 €
Analysis
Structure of prices per m²
Values of price percentiles per m² over the periods used for the estimated price of each type of property.
Structure of transaction amounts
Values of transaction amounts percentiles over the periods used for the estimated price of each type of property.
Transaction amounts and prices per m² by percentile
Percentile
house
Price per m²
Price per m²
house
Transaction amount
Transaction amount
apt.
Price per m²
Price per m²
apt.
Transaction amount
Transaction amount
10th percentile
414 €
50 000 €
471 €
45 000 €
20th percentile
673 €
56 160 €
528 €
67 000 €
30th percentile
784 €
65 600 €
646 €
83 780 €
40th percentile
953 €
79 200 €
691 €
120 K€
50th percentile
1 043 €
100 K€
762 €
125 K€
60th percentile
1 140 €
111 K€
858 €
135 K€
70th percentile
1 271 €
130 K€
917 €
154 K€
80th percentile
1 560 €
140 K€
994 €
211 K€
90th percentile
1 775 €
209 K€
1 068 €
332 K€
National and departmental comparison
Evolution of the median price per m² of houses
Evolution of the median price per m² of apartments
Quarterly data
Quarterly evolution of the median price per m²
Quarterly evolution of the number of transactions
Quarterly table
Quarter
house
transactions
transactions
house
Price per m²
Price per m²
apt.
transactions
transactions
apt.
Price per m²
Price per m²
2025 Q4
37
1 043 €
4
630 €
2025 Q3
20
962 €
1
949 €
2025 Q2
23
1 014 €
1
548 €
2025 Q1
26
912 €
1
1 818 €
2024 Q4
29
903 €
0
--- €
2024 Q3
35
1 139 €
1
1 114 €
2024 Q2
18
1 154 €
0
--- €
2024 Q1
23
703 €
1
1 024 €
2023 Q4
28
1 045 €
2
714 €
2023 Q3
32
986 €
2
428 €
2023 Q2
30
950 €
1
1 048 €
2023 Q1
24
1 100 €
4
778 €
2022 Q4
34
892 €
2
744 €
2022 Q3
41
1 016 €
1
219 €
2022 Q2
35
970 €
1
1 476 €
2022 Q1
29
665 €
3
714 €
2021 Q4
39
882 €
2
768 €
2021 Q3
42
1 025 €
3
368 €
2021 Q2
33
1 029 €
0
--- €
2021 Q1
28
843 €
2
576 €
2020 Q4
33
904 €
4
873 €
2020 Q3
35
769 €
2
304 €
2020 Q2
36
936 €
4
483 €
2020 Q1
32
842 €
3
636 €
2019 Q4
31
776 €
2
544 €
2019 Q3
31
824 €
1
725 €
2019 Q2
27
833 €
4
703 €
2019 Q1
24
920 €
4
593 €
2018 Q4
32
844 €
2
892 €
2018 Q3
24
862 €
2
507 €
2018 Q2
33
959 €
2
778 €
2018 Q1
23
700 €
1
162 €
2017 Q4
26
832 €
2
880 €
2017 Q3
35
966 €
2
396 €
2017 Q2
32
842 €
2
660 €
2017 Q1
31
864 €
0
--- €
2016 Q4
35
874 €
9
370 €
2016 Q3
24
964 €
1
588 €
2016 Q2
21
769 €
0
--- €
2016 Q1
26
836 €
0
--- €
2015 Q4
16
852 €
2
448 €
2015 Q3
20
521 €
4
417 €
2015 Q2
18
768 €
1
276 €
2015 Q1
25
723 €
3
467 €
2014 Q4
20
902 €
2
464 €
2014 Q3
24
880 €
1
596 €
2014 Q2
20
797 €
0
--- €
2014 Q1
22
1 016 €
4
472 €
Key takeaways
What is the price per m2 of houses in Fourmies?
The median price on the 37 house transactions of the last 3 months in the municipality of Fourmies was 1 043 € per square meter for a median property value of 100 000 €. Over this period, 60% of transactions were between 673 and 1 560 € per square meter (from the 2nd to the 8th deciles).
Compare with neighboring municipalities
City
name
name
house
Price per m²
Price per m²
apt.
Price per m²
Price per m²
City information
Zip code
- 59610 FOURMIES