emooki
SearchPrice mapTransactions
🇬🇧 English🇫🇷 Français🇩🇪 Deutsch🇪🇸 Español🇮🇹 Italiano

Real estate price map


Real estate price map in the municipality of Condé-sur-l'Escaut.

Nord (59)
Condé-sur-l'Escaut

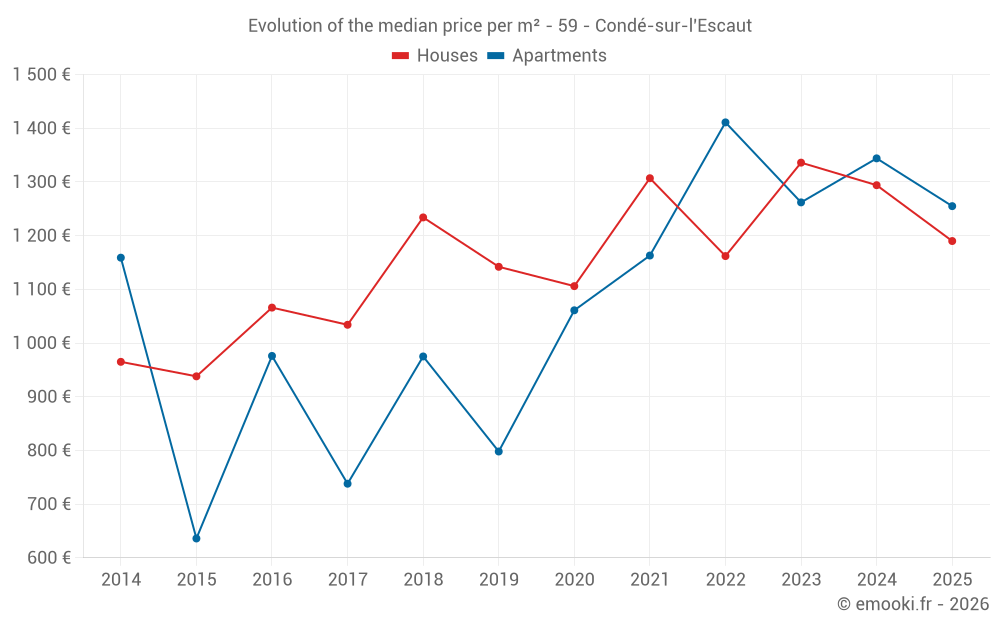
Median price of real estate
in the municipality of Condé-sur-l'Escaut

HousesHouses
1 190 € /m²
1-23-45-67-89-10
Reliability 9/10
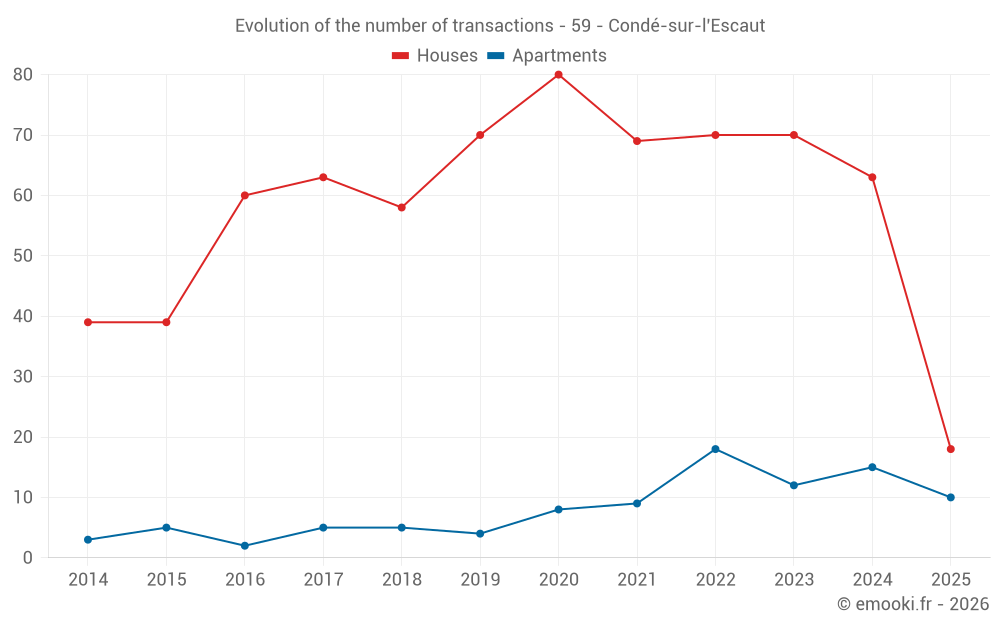
Median price on the 18 transactions of the last 6 months.
from 1 028 to
1 390 € /m²
60% of transactions from the 2nd to the 8th deciles.
ApartmentsApartments
1 280 € /m²
1-23-45-67-89-10
Reliability 8/10
Median price on the 18 transactions of the last 12 months.
from 1 211 to
1 392 € /m²
60% of transactions from the 2nd to the 8th deciles.
DwellingsDwellings
1 242 € /m²
1-23-45-67-89-10
Reliability 9/10
Median price on the 28 transactions of the last 6 months.
from 1 070 to
1 348 € /m²
60% of transactions from the 2nd to the 8th deciles.
HousesEvolution of the price per m² of houses
1 year
-8%
2 years
-10.9%
3 years
+2.4%
4 years
-9%
5 years
+7.6%
6 years
+4.2%
7 years
-3.6%
8 years
+15.1%
9 years
+11.6%
10 years
+26.9%
11 years
+23.3%
ApartmentsEvolution of the price per m² of apartments
1 year
-6.6%
2 years
-0.6%
3 years
-11.1%
4 years
+7.9%
5 years
+18.3%
6 years
--
7 years
+28.7%
8 years
+70.1%
9 years
--
10 years
+97.3%
11 years
--

Yearly evolution

Median price per m²

Number of transactions

Warning, last year incomplete. Projections made based on the proportions between semesters of the previous year at the departmental/national level and by type of property.

Yearly data

Descending order
Year
Houses
house
Price per m²
Houses
house
transactions
Apartments
apt.
Price per m²
Apartments
apt.
transactions
2025
1 190 €
18
1 255 €
10
2024
1 294 €
63
1 344 €
15
2023
1 336 €
70
1 262 €
12
2022
1 162 €
70
1 411 €
18
2021
1 307 €
69
1 163 €
9
2020
1 106 €
80
1 061 €
8
2019
1 142 €
70
798 €
4
2018
1 234 €
58
975 €
5
2017
1 034 €
63
738 €
5
2016
1 066 €
60
976 €
2
2015
938 €
39
636 €
5
2014
965 €
39
1 159 €
3

Quarterly evolution

Median price per m²

Number of transactions

Analysis

Structure of prices per m²

Values of price percentiles per m² over the periods used for the estimated price of each type of property.

Nord (59)

Most expensive cities

City
name
Descending orderHouses
house
Price per m²
4 288 €
4 040 €
3 690 €
3 687 €
3 679 €
3 662 €
3 504 €
City
name
Descending orderApartments
apt.
Price per m²
222 500 €
4 442 €
4 266 €
3 985 €
3 879 €
3 806 €
3 766 €
3 747 €
3 694 €
3 671 €

Least expensive cities

City
name
Ascending orderHouses
house
Price per m²
585 €
671 €
746 €
758 €
786 €
797 €
816 €
City
name
Ascending orderApartments
apt.
Price per m²
158 €
204 €
264 €
282 €
306 €
353 €
358 €