Real estate price map
Real estate price map in the municipality of Aniche, choose a section to see transactions by parcel.
Nord (59)
Price per m² in Aniche
Median price of real estate
in the municipality of Aniche
Houses
1 250 € /m²
Reliability 10/10
Median price on the 33 transactions of the last 3 months.
from 738 to
1 655 € /m²
1 655 € /m²
60% of transactions from the 2nd to the 8th deciles.
Apartments
888 € /m²
Reliability 6/10
Median price on the 15 transactions of the last 36 months.
from 569 to
1 123 € /m²
1 123 € /m²
60% of transactions from the 2nd to the 8th deciles.
Dwellings
1 246 € /m²
Reliability 10/10
Median price on the 35 transactions of the last 3 months.
from 634 to
1 632 € /m²
1 632 € /m²
60% of transactions from the 2nd to the 8th deciles.
Evolution of the price per m² of houses since...
1 year
+0.9%
2 years
-0.4%
3 years
-0.9%
4 years
-1.5%
5 years
+6%
6 years
+11%
7 years
+16%
8 years
+17%
9 years
+15%
10 years
+11%
11 years
+12%
The price per m² of houses has decreased by 1.5% since 4 years, but it has increased by 17% in 8 years.
Evolution of the price per m² of apartments since...
1 year
+2.1%
2 years
+0.7%
3 years
+1.8%
4 years
--
5 years
-15%
6 years
+46%
7 years
+0.1%
8 years
+26%
9 years
--
10 years
--
11 years
--
The price per m² of apartments has decreased by 15% since 5 years, but it has increased by 46% in 6 years.
1545 transactions listed in the municipality
Yearly data
Yearly evolution of the median price per m²

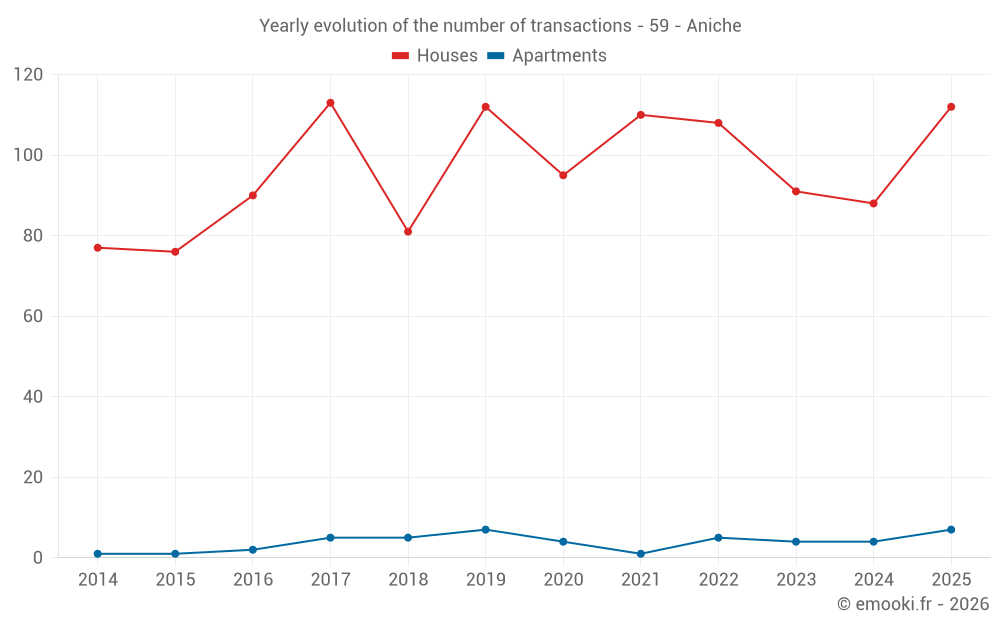
Yearly evolution of the number of transactions
Yearly table
Year
house
transactions
transactions
house
Price per m²
Price per m²
apt.
transactions
transactions
apt.
Price per m²
Price per m²
2025
112
1 150 €
7
888 €
2024
88
1 140 €
4
870 €
2023
91
1 155 €
4
882 €
2022
108
1 160 €
5
872 €
2021
110
1 168 €
1
996 €
2020
95
1 085 €
4
1 048 €
2019
112
1 040 €
7
607 €
2018
81
995 €
5
887 €
2017
113
984 €
5
704 €
2016
90
1 003 €
2
710 €
2015
76
1 036 €
1
310 €
2014
77
1 029 €
1
1 570 €
Analysis
Structure of prices per m²
Values of price percentiles per m² over the periods used for the estimated price of each type of property.
Structure of transaction amounts
Values of transaction amounts percentiles over the periods used for the estimated price of each type of property.
Transaction amounts and prices per m² by percentile
Percentile
house
Price per m²
Price per m²
house
Transaction amount
Transaction amount
apt.
Price per m²
Price per m²
apt.
Transaction amount
Transaction amount
10th percentile
605 €
49 000 €
374 €
78 400 €
20th percentile
738 €
75 000 €
569 €
94 600 €
30th percentile
1 111 €
87 400 €
637 €
116 K€
40th percentile
1 213 €
104 K€
788 €
119 K€
50th percentile
1 250 €
123 K€
888 €
120 K€
60th percentile
1 437 €
130 K€
938 €
141 K€
70th percentile
1 545 €
139 K€
989 €
163 K€
80th percentile
1 655 €
152 K€
1 123 €
197 K€
90th percentile
1 871 €
177 K€
1 196 €
238 K€
National and departmental comparison
Evolution of the median price per m² of houses
Evolution of the median price per m² of apartments
Quarterly data
Quarterly evolution of the median price per m²
Quarterly evolution of the number of transactions
Quarterly table
Quarter
house
transactions
transactions
house
Price per m²
Price per m²
apt.
transactions
transactions
apt.
Price per m²
Price per m²
2025 Q4
33
1 250 €
2
382 €
2025 Q3
28
1 079 €
1
1 617 €
2025 Q2
27
1 039 €
2
916 €
2025 Q1
24
1 140 €
2
868 €
2024 Q4
23
1 338 €
3
607 €
2024 Q3
17
1 065 €
0
--- €
2024 Q2
28
1 135 €
0
--- €
2024 Q1
20
1 165 €
1
1 133 €
2023 Q4
26
1 130 €
0
--- €
2023 Q3
23
1 089 €
2
916 €
2023 Q2
21
1 154 €
1
723 €
2023 Q1
21
1 297 €
1
933 €
2022 Q4
19
1 112 €
1
2 163 €
2022 Q3
34
1 169 €
1
708 €
2022 Q2
35
1 257 €
1
1 049 €
2022 Q1
20
1 156 €
2
811 €
2021 Q4
23
1 010 €
0
--- €
2021 Q3
37
1 185 €
1
996 €
2021 Q2
28
1 196 €
0
--- €
2021 Q1
22
1 126 €
0
--- €
2020 Q4
39
1 026 €
1
991 €
2020 Q3
22
1 202 €
2
1 048 €
2020 Q2
21
893 €
1
1 333 €
2020 Q1
13
1 126 €
0
--- €
2019 Q4
25
1 198 €
2
740 €
2019 Q3
25
1 154 €
2
454 €
2019 Q2
37
938 €
1
1 154 €
2019 Q1
25
1 085 €
2
556 €
2018 Q4
24
1 264 €
1
887 €
2018 Q3
19
887 €
1
964 €
2018 Q2
22
1 050 €
2
846 €
2018 Q1
16
714 €
1
544 €
2017 Q4
24
950 €
1
494 €
2017 Q3
34
888 €
2
654 €
2017 Q2
35
1 133 €
0
--- €
2017 Q1
20
930 €
2
954 €
2016 Q4
25
1 024 €
2
710 €
2016 Q3
29
945 €
0
--- €
2016 Q2
18
1 011 €
0
--- €
2016 Q1
18
1 000 €
0
--- €
2015 Q4
16
1 012 €
0
--- €
2015 Q3
21
976 €
1
310 €
2015 Q2
26
1 032 €
0
--- €
2015 Q1
13
1 069 €
0
--- €
2014 Q4
24
1 239 €
1
1 570 €
2014 Q3
16
1 062 €
0
--- €
2014 Q2
16
794 €
0
--- €
2014 Q1
21
951 €
0
--- €
Key takeaways
What is the price per m2 of houses in Aniche?
The median price on the 33 house transactions of the last 3 months in the municipality of Aniche was 1 250 € per square meter for a median property value of 123 100 €. Over this period, 60% of transactions were between 738 and 1 655 € per square meter (from the 2nd to the 8th deciles).
Compare with neighboring municipalities
City
name
name
house
Price per m²
Price per m²
apt.
Price per m²
Price per m²
City information
Zip code
- 59580 ANICHE