emooki
HomePrice mapTransactions
🇬🇧 English🇫🇷 Français🇩🇪 Deutsch🇪🇸 Español🇮🇹 Italiano

Real estate price map


Real estate price map in the municipality of Ploemel, choose a section to see transactions by parcel.

Morbihan (56)

Ploemel - Real estate price m²

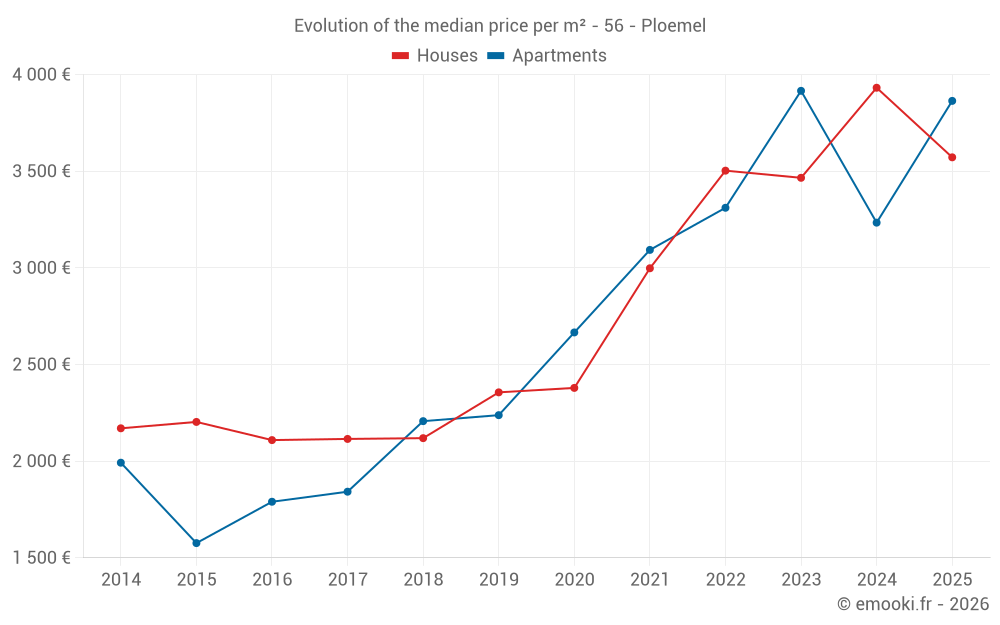
Median price of real estate
in the municipality of Ploemel

HousesHouses
3 527  /m²
1-23-45-67-89-10
Reliability 8/10
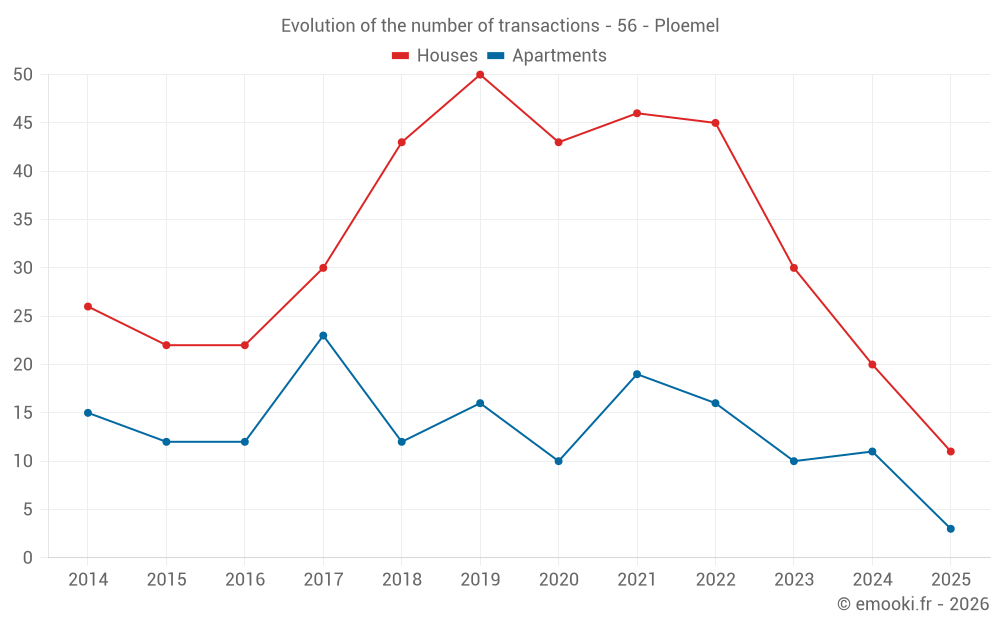
Median price on the 18 transactions of the last 12 months.
from 2 938 to
4 115  /m²
60% of transactions from the 2nd to the 8th deciles.
ApartmentsApartments
3 636  /m²
1-23-45-67-89-10
Reliability 7/10
Median price on the 19 transactions of the last 24 months.
from 3 172 to
4 089  /m²
60% of transactions from the 2nd to the 8th deciles.
DwellingsDwellings
3 572  /m²
1-23-45-67-89-10
Reliability 8/10
Median price on the 27 transactions of the last 12 months.
from 2 930 to
4 141  /m²
60% of transactions from the 2nd to the 8th deciles.
HousesEvolution of the price per m² of houses since...
1 year
-9.2%
2 years
+3.1%
3 years
+2%
4 years
+19%
5 years
+50%
6 years
+52%
7 years
+69%
8 years
+69%
9 years
+69%
10 years
+62%
11 years
+65%
The price per m² of houses has decreased by 9.2% since 1 year, but it has increased by 69% in 9 years.

Yearly evolution

Evolution of the median price per m²

Evolution of the median price per m² - 56 - Ploemel

Evolution of the number of transactions

Warning, last year incomplete. Projections made based on the proportions between semesters of the previous year at the departmental/national level and by type of property.

Evolution of the number of transactions - 56 - Ploemel

Yearly data

Descending order
Year
Houses
house
transactions
Houses
house
Price per m²
Apartments
apt.
transactions
Apartments
apt.
Price per m²
2025
11
3 572 
3
3 864 
2024
20
3 932 
11
3 234 
2023
30
3 466 
10
3 916 
2022
45
3 503 
16
3 311 
2021
46
2 998 
19
3 093 
2020
43
2 379 
10
2 666 
2019
50
2 356 
16
2 238 
2018
43
2 119 
12
2 207 
2017
30
2 115 
23
1 842 
2016
22
2 109 
12
1 790 
2015
22
2 203 
12
1 576 
2014
26
2 170 
15
1 992 

Analysis

Structure of prices per m²

Values of price percentiles per m² over the periods used for the estimated price of each type of property.

Structure of transaction amounts

Values of transaction amounts percentiles over the periods used for the estimated price of each type of property.

Transaction amounts and prices per m² by percentile

Ascending order
Percentile
Houses
house
Price per m²
Houses
house
Transaction amount
Apartments
apt.
Price per m²
Apartments
apt.
Transaction amount
10th percentile
2 434 
215 K
2 937 
132 K
20th percentile
2 938 
262 K
3 172 
138 K
30th percentile
3 313 
307 K
3 260 
143 K
40th percentile
3 378 
321 K
3 385 
153 K
50th percentile
3 527 
333 K
3 636 
158 K
60th percentile
3 788 
354 K
3 902 
168 K
70th percentile
3 925 
370 K
3 991 
175 K
80th percentile
4 115 
394 K
4 089 
176 K
90th percentile
4 364 
419 K
4 325 
221 K

National and departmental comparison

Evolution of the median price per m² of houses

Evolution of the median price per m² of apartments

Quarterly evolution

Evolution of the median price per m²

Evolution of the number of transactions

Quarterly data

Descending order
Quarter
Houses
house
transactions
Houses
house
Price per m²
Apartments
apt.
transactions
Apartments
apt.
Price per m²
2025 Q2
3
4 392 
1
4 001 
2025 Q1
8
3 476 
2
3 750 
2024 Q4
5
3 828 
3
4 245 
2024 Q3
2
3 060 
3
2 928 
2024 Q2
10
4 152 
2
3 990 
2024 Q1
3
4 471 
3
3 234 
2023 Q4
6
3 331 
2
4 066 
2023 Q3
7
4 000 
3
3 592 
2023 Q2
8
2 938 
4
4 031 
2023 Q1
9
3 900 
1
3 289 
2022 Q4
9
3 800 
4
3 612 
2022 Q3
11
3 265 
2
2 684 
2022 Q2
14
3 978 
5
3 272 
2022 Q1
11
3 214 
5
3 155 
2021 Q4
11
3 286 
2
2 492 
2021 Q3
11
3 362 
10
3 421 
2021 Q2
13
3 129 
5
2 692 
2021 Q1
11
2 190 
2
2 903 
2020 Q4
13
2 798 
2
3 173 
2020 Q3
7
2 536 
3
2 771 
2020 Q2
9
2 160 
1
2 243 
2020 Q1
14
2 041 
4
2 496 
2019 Q4
15
2 348 
5
2 333 
2019 Q3
14
2 365 
4
2 218 
2019 Q2
11
2 450 
6
2 238 
2019 Q1
10
2 188 
1
2 035 
2018 Q4
16
2 056 
2
2 040 
2018 Q3
10
2 208 
4
2 297 
2018 Q2
8
2 404 
3
1 487 
2018 Q1
9
1 928 
3
2 439 
2017 Q4
8
2 024 
9
1 895 
2017 Q3
6
2 097 
7
1 946 
2017 Q2
12
2 112 
5
1 674 
2017 Q1
4
2 888 
2
1 873 
2016 Q4
5
1 993 
1
1 351 
2016 Q3
5
1 711 
4
1 976 
2016 Q2
7
2 175 
3
1 829 
2016 Q1
5
2 073 
4
1 841 
2015 Q4
5
2 293 
2
1 379 
2015 Q3
8
2 428 
3
1 857 
2015 Q2
7
1 979 
3
1 577 
2015 Q1
2
1 820 
4
1 448 
2014 Q4
10
1 700 
1
1 808 
2014 Q3
5
2 389 
3
1 992 
2014 Q2
7
2 347 
4
2 118 
2014 Q1
4
2 145 
7
1 948 

Overview of the latest real estate transactions

The following list is an anonymized overview of the latest transactions. For more details and to find all transactions, please use the map to view transactions by plot or the transaction search page for a search by criteria.

2025-06-17
325 000 
4 392  /m²(74 m²)
Sale
Houses
House
2 rooms
74 m2
Land
1208 m2
-Sols
Land
266 m2
-Futaies résineuses
Land
1079 m2
-Prés
Land
2811 m2
-Prés
Land
1629 m2
-Sols
Land
948 m2
-Prés
Land
1122 m2
-Terres
2025-06-17
140 050 
4 001  /m²(35 m²)
Sale
Apartments
Apartment
2 rooms
35 m2
2 outbuildings
2025-06-13
400 000 
1 389  /m²(288 m²)
Sale
Commercial property
288 m2
Land
950 m2
-Sols
2025-06-11
76 900 
Sale
Land
200 m2
-Terrains à bâtir
2025-05-27
63 000 
Sale
Land
156 m2
-Terres
Land
197 m2
-Terres
2025-05-26
1 164 
Exchange
Land
1940 m2
-Terres
Land
1940 m2
-Prés
2025-05-15
80 900 
Sale
Land
210 m2
-Terrains à bâtir
2025-04-30
350 000 
1 232  /m²(284 m²)
Sale
Commercial property
284 m2
Land
888 m2
-Sols
Land
332 m2
-Sols
2025-04-30
4 000 
Sale
Land
1250 m2
-Terres
Land
2990 m2
-Terres
Land
1600 m2
-Terres
Land
4550 m2
-Terres
Land
460 m2
-Landes
Land
460 m2
-Landes
2025-04-29
115 140 
Sale
Land
311 m2
-Terrains à bâtir
2025-04-29
121 900 
Sale
Land
329 m2
-Terrains à bâtir
2025-04-25
368 000 
2 726  /m²(135 m²)
Sale
Houses
House
4 rooms
135 m2
Land
471 m2
-Sols
2025-04-10
280 000 
5 385  /m²(52 m²)
Sale
Houses
House
6 rooms
52 m2
1 outbuilding
Land
135 m2
-Sols
2025-03-20
30 000 
Sale
Land
24790 m2
-Futaies résineuses
Land
31520 m2
-Landes
Land
10370 m2
-Futaies résineuses
2025-03-18
84 000 
Sale
Land
149 m2
-Terres
Land
316 m2
-Terres
2025-03-18
78 000 
Sale
Land
174 m2
-Terres
Land
261 m2
-Terres
2025-03-12
61 000 
Sale
Land
326 m2
-Terres
2025-03-05
340 000 
1 753  /m²(194 m²)
Sale
Land
14 m2
-Terrains d'agrément
Houses
House
2 rooms
73 m2
Land
54 m2
-Sols
Houses
House
5 rooms
121 m2
Land
661 m2
-Sols
Land
719 m2
-Terrains d'agrément
Land
760 m2
-Terrains d'agrément
2025-03-04
50 000 
Sale
Land
810 m2
-Landes
Land
28 m2
-Sols
Land
1050 m2
-Prés
Land
5150 m2
-Prés
Land
24045 m2
-Prés
2025-02-27
200 000 
3 125  /m²(64 m²)
Sale
Houses
House
1 room
64 m2
Land
1335 m2
-Sols
Land
840 m2
-Prés
1012 transactions listed in the municipality

Morbihan (56)

Most expensive cities

City
name
Descending orderHouses
house
Price per m²
6 560 
5 843 
5 741 
5 625 
5 440 
5 366 
5 319 
5 302 
5 112 
City
name
Descending orderApartments
apt.
Price per m²
6 879 
5 986 
5 736 
5 232 
5 000 
4 948 
4 613 

Least expensive cities

City
name
Ascending orderHouses
house
Price per m²
747 
788 
904 
920 
921 
949 
1 020 
City
name
Ascending orderApartments
apt.
Price per m²
167 
325 
368 
388 
417 
430 
432 
458 
475 
482