emooki
HomePrice mapTransactions
🇬🇧 English🇫🇷 Français🇩🇪 Deutsch🇪🇸 Español🇮🇹 Italiano

Real estate price map


Real estate price map in the municipality of Auray, choose a section to see transactions by parcel.

Morbihan (56)

Auray - Real estate price m²

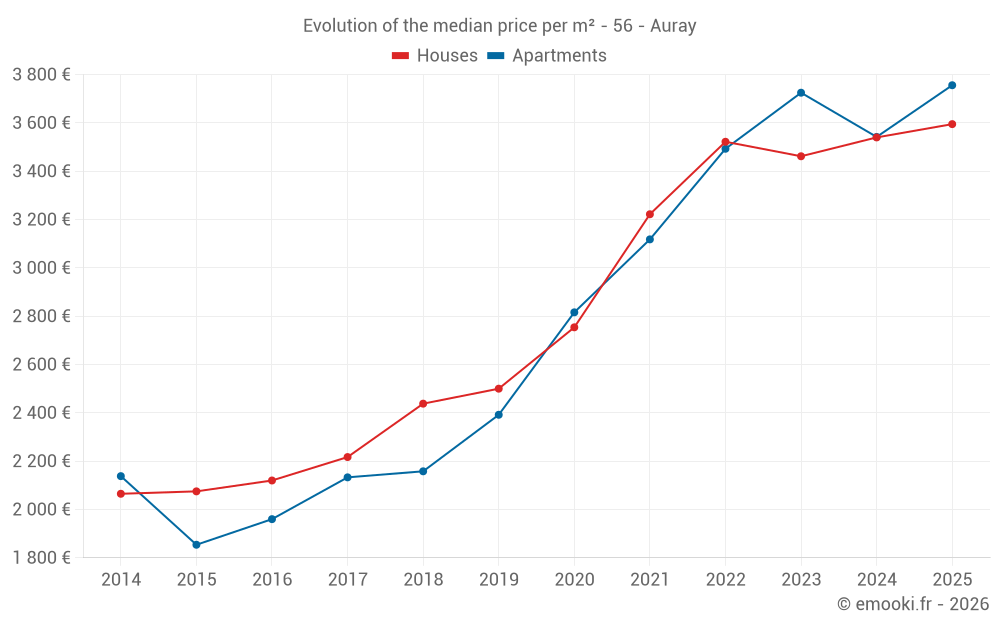
Median price of real estate
in the municipality of Auray

HousesHouses
3 595  /m²
1-23-45-67-89-10
Reliability 9/10
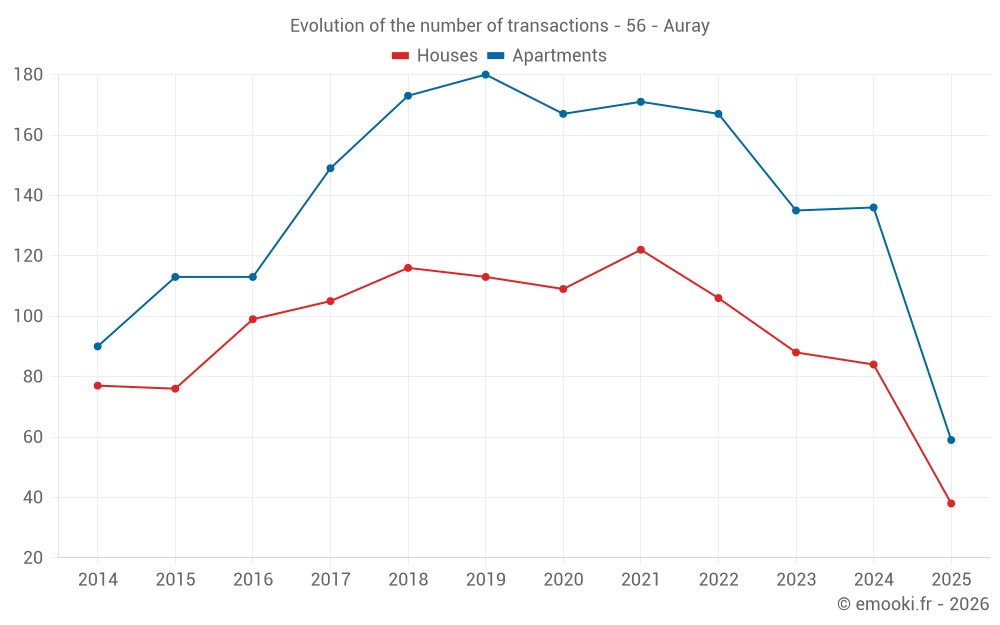
Median price on the 38 transactions of the last 6 months.
from 3 107 to
4 229  /m²
60% of transactions from the 2nd to the 8th deciles.
ApartmentsApartments
3 780  /m²
1-23-45-67-89-10
Reliability 10/10
Median price on the 30 transactions of the last 3 months.
from 2 913 to
4 103  /m²
60% of transactions from the 2nd to the 8th deciles.
DwellingsDwellings
3 852  /m²
1-23-45-67-89-10
Reliability 10/10
Median price on the 46 transactions of the last 3 months.
from 3 182 to
4 224  /m²
60% of transactions from the 2nd to the 8th deciles.
HousesEvolution of the price per m² of houses since...
1 year
+1.6%
2 years
+3.8%
3 years
+2.1%
4 years
+12%
5 years
+31%
6 years
+44%
7 years
+47%
8 years
+62%
9 years
+70%
10 years
+73%
11 years
+74%
ApartmentsEvolution of the price per m² of apartments since...
1 year
+6%
2 years
+0.8%
3 years
+7.5%
4 years
+20%
5 years
+33%
6 years
+57%
7 years
+74%
8 years
+76%
9 years
+92%
10 years
+103%
11 years
+76%

Yearly evolution

Evolution of the median price per m²

Evolution of the median price per m² - 56 - Auray

Evolution of the number of transactions

Warning, last year incomplete. Projections made based on the proportions between semesters of the previous year at the departmental/national level and by type of property.

Evolution of the number of transactions - 56 - Auray

Yearly data

Descending order
Year
Houses
house
transactions
Houses
house
Price per m²
Apartments
apt.
transactions
Apartments
apt.
Price per m²
2025
38
3 595 
59
3 756 
2024
84
3 540 
136
3 542 
2023
88
3 462 
135
3 725 
2022
106
3 522 
167
3 493 
2021
122
3 222 
171
3 118 
2020
109
2 754 
167
2 816 
2019
113
2 500 
180
2 392 
2018
116
2 438 
173
2 158 
2017
105
2 217 
149
2 133 
2016
99
2 120 
113
1 960 
2015
76
2 075 
113
1 854 
2014
77
2 065 
90
2 138 

Analysis

Structure of prices per m²

Values of price percentiles per m² over the periods used for the estimated price of each type of property.

Structure of transaction amounts

Values of transaction amounts percentiles over the periods used for the estimated price of each type of property.

Transaction amounts and prices per m² by percentile

Ascending order
Percentile
Houses
house
Price per m²
Houses
house
Transaction amount
Apartments
apt.
Price per m²
Apartments
apt.
Transaction amount
10th percentile
2 671 
229 K
2 452 
88 000 
20th percentile
3 107 
278 K
2 913 
102 K
30th percentile
3 311 
316 K
3 450 
149 K
40th percentile
3 425 
343 K
3 573 
153 K
50th percentile
3 595 
385 K
3 780 
174 K
60th percentile
3 838 
398 K
3 910 
223 K
70th percentile
3 908 
448 K
3 968 
234 K
80th percentile
4 229 
502 K
4 103 
250 K
90th percentile
4 890 
678 K
4 235 
294 K

National and departmental comparison

Evolution of the median price per m² of houses

Evolution of the median price per m² of apartments

Quarterly evolution

Evolution of the median price per m²

Evolution of the number of transactions

Quarterly data

Descending order
Quarter
Houses
house
transactions
Houses
house
Price per m²
Apartments
apt.
transactions
Apartments
apt.
Price per m²
2025 Q2
16
3 964 
30
3 780 
2025 Q1
22
3 413 
29
3 683 
2024 Q4
24
3 431 
40
3 649 
2024 Q3
21
3 614 
34
3 685 
2024 Q2
29
3 648 
33
3 448 
2024 Q1
10
3 424 
29
3 492 
2023 Q4
21
3 484 
34
3 564 
2023 Q3
19
3 765 
32
3 400 
2023 Q2
27
3 330 
36
3 782 
2023 Q1
21
3 158 
33
3 837 
2022 Q4
29
3 632 
35
3 402 
2022 Q3
22
3 618 
38
3 720 
2022 Q2
31
3 383 
49
3 625 
2022 Q1
24
3 651 
45
3 266 
2021 Q4
27
3 648 
35
3 333 
2021 Q3
26
3 009 
43
3 233 
2021 Q2
39
3 304 
48
2 860 
2021 Q1
30
2 785 
45
3 000 
2020 Q4
27
2 897 
52
2 898 
2020 Q3
35
3 088 
33
2 955 
2020 Q2
25
2 754 
35
2 606 
2020 Q1
22
2 336 
47
2 843 
2019 Q4
30
2 578 
46
2 370 
2019 Q3
32
2 755 
56
2 507 
2019 Q2
35
2 453 
38
2 493 
2019 Q1
16
2 338 
40
2 062 
2018 Q4
32
2 552 
38
2 114 
2018 Q3
36
2 297 
54
2 160 
2018 Q2
20
2 474 
49
2 206 
2018 Q1
28
2 336 
32
2 094 
2017 Q4
20
2 168 
39
1 992 
2017 Q3
34
2 266 
34
2 054 
2017 Q2
31
2 247 
42
2 228 
2017 Q1
20
2 168 
34
2 232 
2016 Q4
14
2 150 
26
1 962 
2016 Q3
29
2 465 
30
1 861 
2016 Q2
32
2 020 
29
2 075 
2016 Q1
24
1 948 
28
1 821 
2015 Q4
21
2 000 
38
1 915 
2015 Q3
27
2 383 
32
1 770 
2015 Q2
14
2 206 
21
1 885 
2015 Q1
14
1 631 
22
1 678 
2014 Q4
26
2 092 
24
2 100 
2014 Q3
22
2 321 
22
2 219 
2014 Q2
16
1 730 
23
1 950 
2014 Q1
13
2 147 
21
2 134 

Overview of the latest real estate transactions

The following list is an anonymized overview of the latest transactions. For more details and to find all transactions, please use the map to view transactions by plot or the transaction search page for a search by criteria.

2025-06-27
555 000 
3 908  /m²(142 m²)
Sale
Houses
House
4 rooms
142 m2
Land
341 m2
-Sols
2025-06-23
7 000 
Sale
1 outbuilding
2025-06-18
69 700 
3 872  /m²(18 m²)
Sale
Apartments
Apartment
1 room
18 m2
1 outbuilding
2025-06-17
92 900 
4 223  /m²(22 m²)
Sale
Apartments
Apartment
1 room
22 m2
1 outbuilding
2025-06-16
70 000 
3 500  /m²(20 m²)
Sale
Apartments
Apartment
1 room
20 m2
1 outbuilding
2025-06-12
300 000 
4 918  /m²(61 m²)
Sale
Houses
House
3 rooms
61 m2
Land
59 m2
-Sols
2025-06-12
150 
Sale
Land
87 m2
-Terrains à bâtir
Land
92 m2
-Sols
Land
3519 m2
-Terrains à bâtir
Land
985 m2
-Landes
Land
21 m2
-Sols
Land
20 m2
-Sols
Land
9 m2
-Sols
2025-06-11
386 000 
4 021  /m²(96 m²)
Sale
Houses
House
5 rooms
96 m2
Land
536 m2
-Sols
2025-06-11
400 000 
4 878  /m²(82 m²)
Sale
Houses
House
3 rooms
82 m2
Land
342 m2
-Sols
2025-06-03
240 000 
2 424  /m²(99 m²)
Sale
Houses
House
5 rooms
99 m2
Land
465 m2
-Sols
2025-05-28
393 460 
3 027  /m²(130 m²)
Sale
Houses
House
5 rooms
130 m2
Land
401 m2
-Sols
2025-05-28
30 000 
Sale
1 outbuilding
2025-05-27
325 000 
4 114  /m²(79 m²)
Sale
Houses
House
3 rooms
79 m2
Land
484 m2
-Sols
2025-05-27
15 500 
Sale
1 outbuilding
2025-05-22
9 261 
Sale
Land
11321 m2
-Prés
Land
594 m2
-Landes
Land
672 m2
-Sols
2025-05-20
262 000 
4 367  /m²(60 m²)
Sale
Apartments
Apartment
3 rooms
60 m2
1 outbuilding
2025-05-19
215 400 
4 224  /m²(51 m²)
Sale
Apartments
Apartment
3 rooms
51 m2
1 outbuilding
2025-05-19
110 000 
Sale
Land
318 m2
-Sols
Land
50 m2
-Sols
2025-04-30
265 000 
2 054  /m²(129 m²)
Sale
Apartments
Apartment
4 rooms
129 m2
2 outbuildings
2025-04-30
335 000 
3 722  /m²(90 m²)
Sale
Houses
House
5 rooms
90 m2
Land
395 m2
-Sols
4422 transactions listed in the municipality

Morbihan (56)

Most expensive cities

City
name
Descending orderHouses
house
Price per m²
6 560 
5 843 
5 741 
5 625 
5 440 
5 366 
5 319 
5 302 
5 112 
City
name
Descending orderApartments
apt.
Price per m²
6 879 
5 986 
5 736 
5 232 
5 000 
4 948 
4 613 

Least expensive cities

City
name
Ascending orderHouses
house
Price per m²
747 
788 
904 
920 
921 
949 
1 020 
City
name
Ascending orderApartments
apt.
Price per m²
167 
325 
368 
388 
417 
430 
432 
458 
475 
482