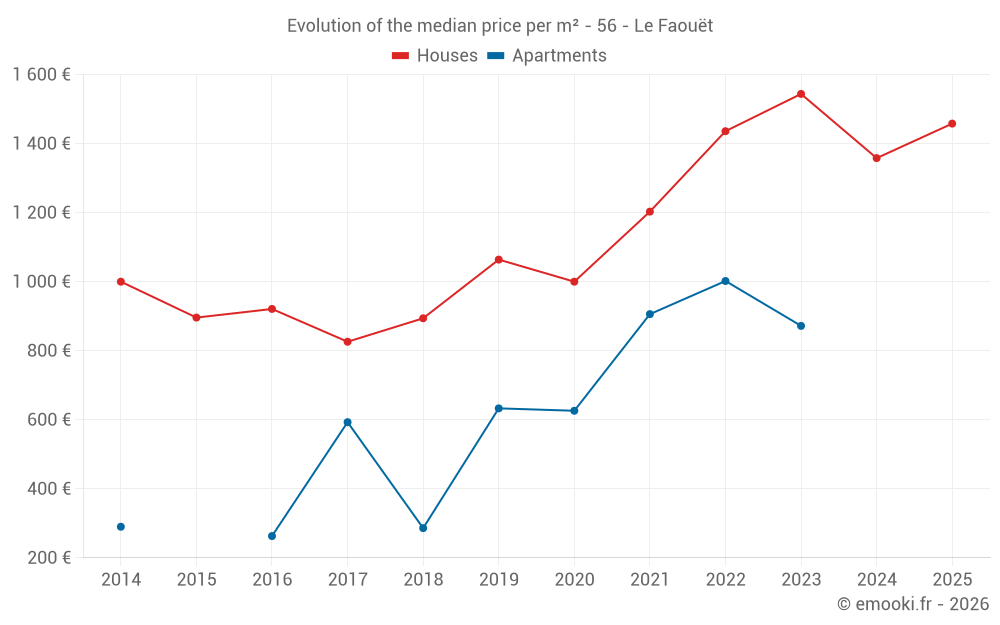
Median price of real estate
in the municipality of Le Faouët
Houses
1 458 € /m²
Reliability 9/10
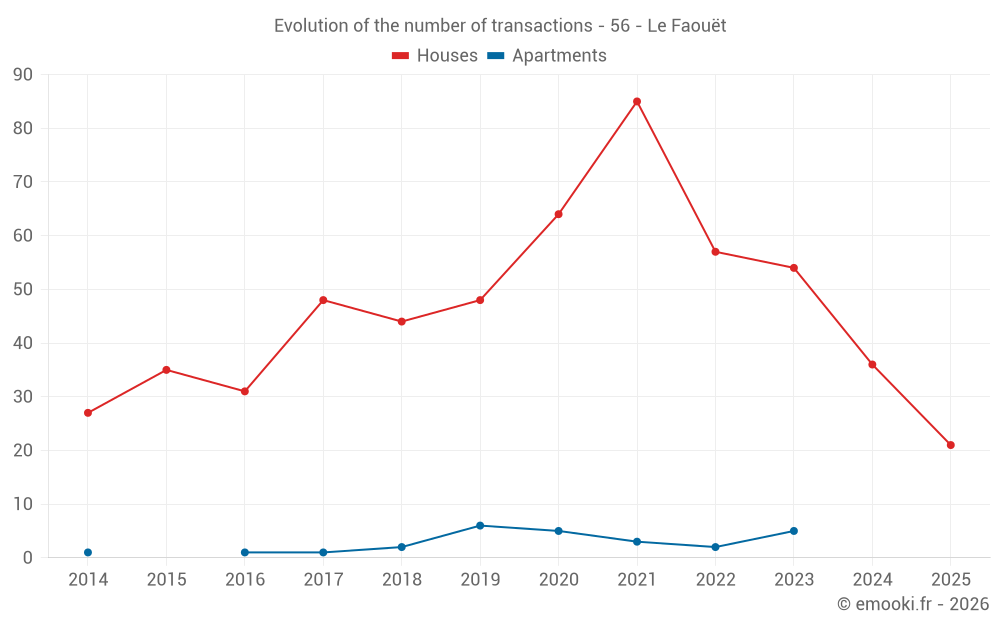
Median price on the 21 transactions of the last 6 months.
from 822 to
2 054 € /m²
2 054 € /m²
60% of transactions from the 2nd to the 8th deciles.
Apartments
792 € /m²
Reliability 4/10
Median price on the 13 transactions of the last 60 months.
from 646 to
1 161 € /m²
1 161 € /m²
60% of transactions from the 2nd to the 8th deciles.
Dwellings
1 458 € /m²
Reliability 9/10
Median price on the 21 transactions of the last 6 months.
from 822 to
2 054 € /m²
2 054 € /m²
60% of transactions from the 2nd to the 8th deciles.