Real estate price map
Real estate price map in the municipality of Moutrot, choose a section to see transactions by parcel.
Meurthe-et-Moselle (54)
Price per m² in Moutrot
Median price of real estate
in the municipality of Moutrot
Houses
1 525 € /m²
Reliability 4/10
Median price on the 13 transactions of the last 60 months.
from 1 071 to
1 748 € /m²
1 748 € /m²
60% of transactions from the 2nd to the 8th deciles.
Apartments
542 € /m²
Reliability 1/10
Median price on the 2 transactions of the last 120 months.
Dwellings
1 423 € /m²
Reliability 4/10
Median price on the 14 transactions of the last 60 months.
from 1 007 to
1 705 € /m²
1 705 € /m²
60% of transactions from the 2nd to the 8th deciles.
Yearly evolution
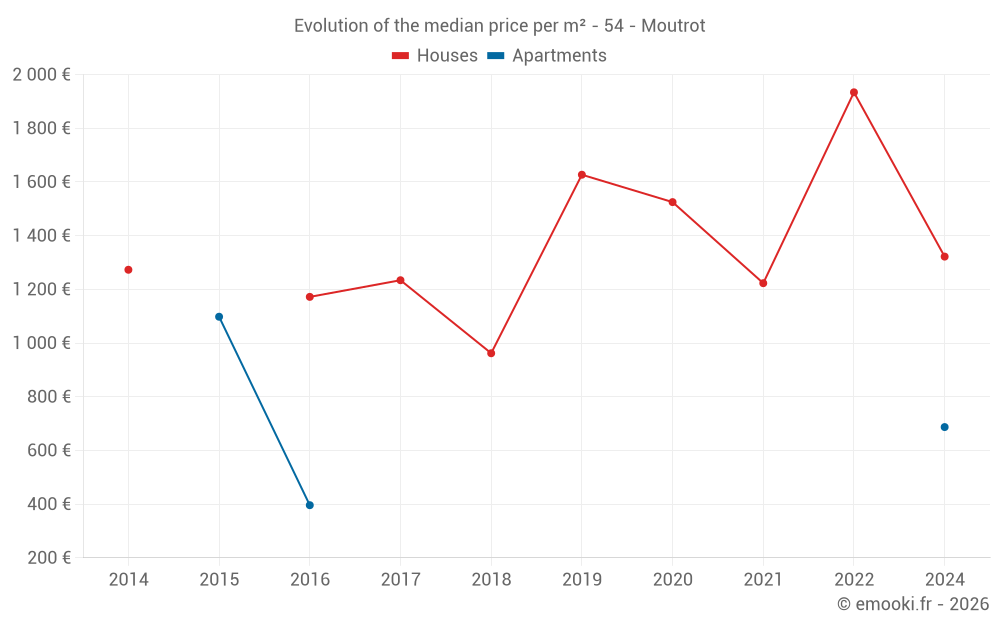
Evolution of the median price per m²
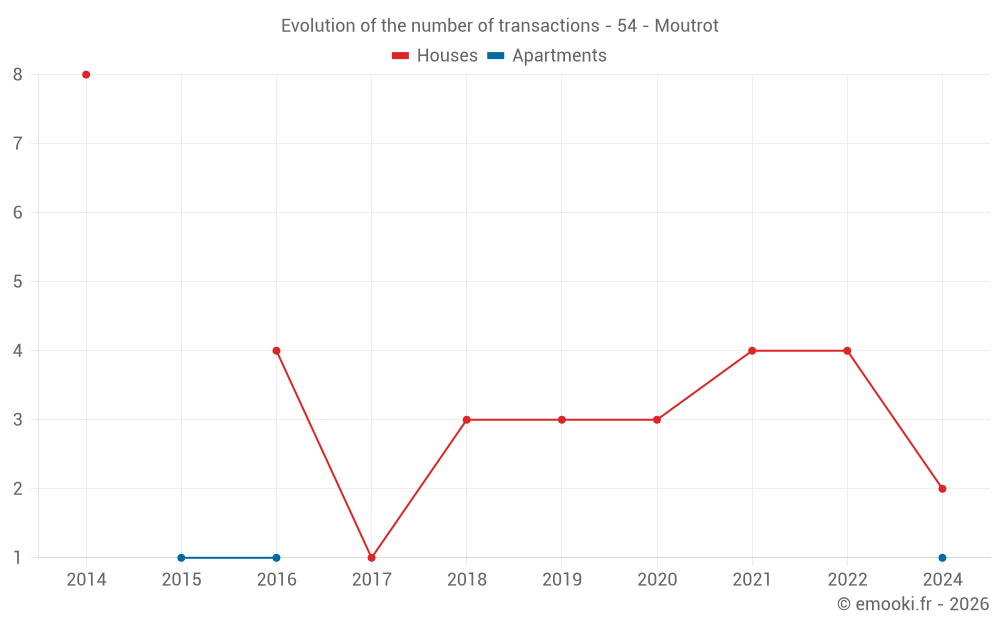
Evolution of the number of transactions
Warning, last year incomplete. Projections made based on the proportions between semesters of the previous year at the departmental/national level and by type of property.
Yearly data
Year
house
transactions
transactions
house
Price per m²
Price per m²
apt.
transactions
transactions
apt.
Price per m²
Price per m²
2025
0
--- €
0
--- €
2024
2
1 322 €
1
687 €
2023
0
--- €
0
--- €
2022
4
1 934 €
0
--- €
2021
4
1 223 €
0
--- €
2020
3
1 525 €
0
--- €
2019
3
1 627 €
0
--- €
2018
3
962 €
0
--- €
2017
1
1 234 €
0
--- €
2016
4
1 172 €
1
396 €
2015
0
--- €
1
1 098 €
2014
8
1 273 €
0
--- €
Analysis
Structure of prices per m²
Values of price percentiles per m² over the periods used for the estimated price of each type of property.
Structure of transaction amounts
Values of transaction amounts percentiles over the periods used for the estimated price of each type of property.
Transaction amounts and prices per m² by percentile
Percentile
house
Price per m²
Price per m²
house
Transaction amount
Transaction amount
apt.
Price per m²
Price per m²
apt.
Transaction amount
Transaction amount
10th percentile
979 €
96 400 €
425 €
107 K€
20th percentile
1 071 €
127 K€
454 €
118 K€
30th percentile
1 187 €
138 K€
483 €
130 K€
40th percentile
1 303 €
164 K€
512 €
141 K€
50th percentile
1 525 €
187 K€
542 €
152 K€
60th percentile
1 582 €
197 K€
571 €
164 K€
70th percentile
1 619 €
212 K€
600 €
175 K€
80th percentile
1 748 €
228 K€
629 €
187 K€
90th percentile
2 166 €
299 K€
658 €
198 K€
National and departmental comparison
Evolution of the median price per m² of houses
Evolution of the median price per m² of apartments
Quarterly evolution
Evolution of the median price per m²
Evolution of the number of transactions
Quarterly data
Quarter
house
transactions
transactions
house
Price per m²
Price per m²
apt.
transactions
transactions
apt.
Price per m²
Price per m²
2024 Q4
1
1 834 €
0
--- €
2024 Q2
0
--- €
1
687 €
2024 Q1
1
811 €
0
--- €
2022 Q4
1
2 249 €
0
--- €
2022 Q3
2
2 130 €
0
--- €
2022 Q2
1
1 229 €
0
--- €
2021 Q3
2
1 447 €
0
--- €
2021 Q2
2
1 045 €
0
--- €
2020 Q4
2
1 280 €
0
--- €
2020 Q3
1
1 619 €
0
--- €
2019 Q4
1
1 627 €
0
--- €
2019 Q2
2
1 076 €
0
--- €
2018 Q3
1
1 587 €
0
--- €
2018 Q2
2
906 €
0
--- €
2017 Q1
1
1 234 €
0
--- €
2016 Q4
2
1 354 €
1
396 €
2016 Q3
1
1 093 €
0
--- €
2016 Q2
1
791 €
0
--- €
2015 Q1
0
--- €
1
1 098 €
2014 Q4
4
1 524 €
0
--- €
2014 Q3
4
897 €
0
--- €
Overview of the latest real estate transactions
The following list is an anonymized overview of the latest transactions. For more details and to find all transactions, please use the map to view transactions by plot or the transaction search page for a search by criteria.
2025-05-21
255 €Sale
Land
1276 m2
-Futaies résineuses
2024-10-16
187 100 €1 834 € /m²(102 m²)
Sale
House
4 rooms
102 m2
Land
546 m2
-Sols
2024-10-08
835 €Sale
Land
1627 m2
-Futaies résineuses
Land
543 m2
-Futaies résineuses
Land
849 m2
-Taillis simples
Land
848 m2
-Terres
Land
306 m2
-Taillis simples
2024-10-03
72 500 €Sale
Land
820 m2
-Vergers
2024-08-23
30 000 €Sale
Land
1024 m2
-Terrains à bâtir
2024-05-03
95 500 €687 € /m²(139 m²)
Sale
Apartment
4 rooms
139 m2
2 outbuildings
Land
338 m2
-Sols
Land
35 m2
-Sols
2024-01-16
90 000 €811 € /m²(111 m²)
Sale
House
4 rooms
111 m2
Land
790 m2
-Sols
1 outbuilding
Land
624 m2
-Jardins
2023-04-14
1 000 €Sale
Land
990 m2
-Terres
Land
500 m2
-Vergers
Land
790 m2
-Taillis simples
2023-03-14
520 €Sale
Land
4850 m2
-Terres
2022-12-14
130 €Sale
Land
882 m2
-Futaies résineuses
2022-12-14
250 €Sale
Land
1017 m2
-Futaies résineuses
2022-10-10
193 400 €2 249 € /m²(86 m²)
Sale
House
5 rooms
86 m2
Land
485 m2
-Sols
Land
78 m2
-Terrains à bâtir
2022-09-29
47 000 €Sale
Land
551 m2
-Terrains à bâtir
2022-09-29
500 €Sale
Land
2035 m2
-Futaies résineuses
2022-09-29
600 €Sale
Land
3012 m2
-Taillis simples
2022-08-02
340 000 €1 619 € /m²(210 m²)
Sale
House
6 rooms
210 m2
2 outbuildings
Land
500 m2
-Sols
Land
841 m2
-Jardins
Land
19 m2
-Jardins
Land
6 m2
-Sols
2022-07-19
237 700 €2 641 € /m²(90 m²)
Sale
House
4 rooms
90 m2
Land
753 m2
-Sols
2022-07-13
900 €Sale
Land
3501 m2
-Futaies résineuses
2022-05-13
213 920 €1 229 € /m²(174 m²)
Sale
Land
36 m2
-Sols
House
5 rooms
174 m2
Land
284 m2
-Sols
2022-01-26
450 €Sale
Land
1923 m2
-Futaies résineuses
96 transactions listed in the municipality
Compare with neighboring municipalities
City
name
name
house
Price per m²
Price per m²
apt.
Price per m²
Price per m²
City information
Zip code
- 54113 MOUTROT
Data source & update
- Latest publication of the property value request (DVF) database made available by the DGFiP on October 19, 2025, covering transactions up to 06/30/2025:
- Administrative/cadastral division as of September 1, 2025, and municipal movements as of January 1, 2025: