emooki
HomePrice mapTransactions
🇬🇧 English🇫🇷 Français🇩🇪 Deutsch🇪🇸 Español🇮🇹 Italiano

Real estate price map


Real estate price map in the municipality of Moncel-lès-Lunéville, choose a section to see transactions by parcel.

Meurthe-et-Moselle (54)
Moncel-lès-Lunéville

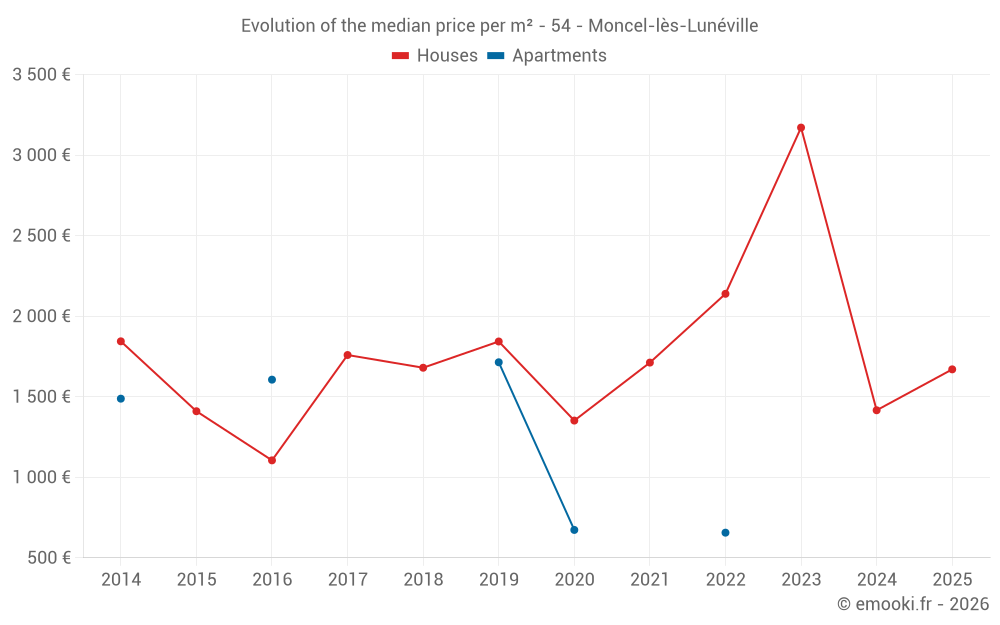
Median price of real estate
in the municipality of Moncel-lès-Lunéville

HousesHouses
1 670  /m²
1-23-45-67-89-10
Reliability 5/10
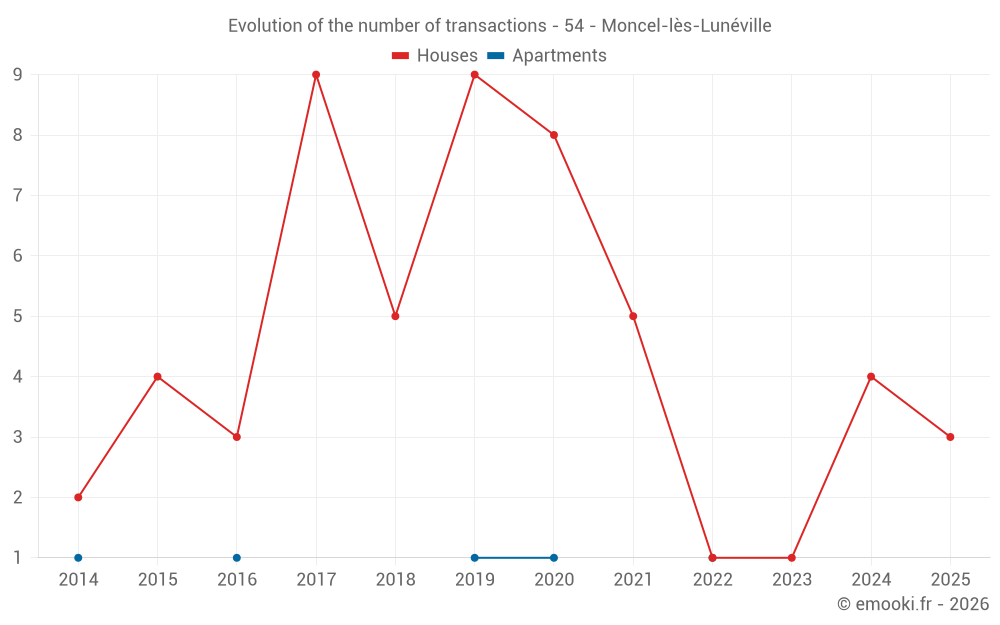
Median price on the 13 transactions of the last 48 months.
from 949 to
2 342  /m²
60% of transactions from the 2nd to the 8th deciles.
ApartmentsApartments
1 140  /m²
1-23-45-67-89-10
Reliability 1/10
Median price on the 4 transactions of the last 120 months.
DwellingsDwellings
1 644  /m²
1-23-45-67-89-10
Reliability 5/10
Median price on the 14 transactions of the last 48 months.
from 726 to
2 294  /m²
60% of transactions from the 2nd to the 8th deciles.

Yearly evolution

Evolution of the median price per m²

Evolution of the number of transactions

Warning, last year incomplete. Projections made based on the proportions between semesters of the previous year at the departmental/national level and by type of property.

Yearly data

Descending order
Year
Houses
house
transactions
Houses
house
Price per m²
Apartments
apt.
transactions
Apartments
apt.
Price per m²
2025
3
1 670 
0
--- 
2024
4
1 416 
0
--- 
2023
1
3 171 
0
--- 
2022
1
2 139 
1
656 
2021
5
1 712 
0
--- 
2020
8
1 352 
1
673 
2019
9
1 843 
1
1 714 
2018
5
1 680 
0
--- 
2017
9
1 759 
0
--- 
2016
3
1 105 
1
1 606 
2015
4
1 410 
0
--- 
2014
2
1 844 
1
1 488 

Analysis

Structure of prices per m²

Values of price percentiles per m² over the periods used for the estimated price of each type of property.

Structure of transaction amounts

Values of transaction amounts percentiles over the periods used for the estimated price of each type of property.

Transaction amounts and prices per m² by percentile

Ascending order
Percentile
Houses
house
Price per m²
Houses
house
Transaction amount
Apartments
apt.
Price per m²
Apartments
apt.
Transaction amount
10th percentile
602 
130 K
661 
89 200 
20th percentile
949 
132 K
666 
102 K
30th percentile
1 421 
142 K
671 
116 K
40th percentile
1 606 
169 K
860 
122 K
50th percentile
1 670 
200 K
1 140 
124 K
60th percentile
1 842 
215 K
1 419 
127 K
70th percentile
2 162 
225 K
1 617 
129 K
80th percentile
2 342 
234 K
1 649 
132 K
90th percentile
2 728 
240 K
1 682 
134 K

National and departmental comparison

Evolution of the median price per m² of houses

Evolution of the median price per m² of apartments

Quarterly evolution

Evolution of the median price per m²

Evolution of the number of transactions

Quarterly data

Descending order
Quarter
Houses
house
transactions
Houses
house
Price per m²
Apartments
apt.
transactions
Apartments
apt.
Price per m²
2025 Q2
1
1 768 
0
--- 
2025 Q1
2
1 614 
0
--- 
2024 Q3
3
1 215 
0
--- 
2024 Q1
1
1 618 
0
--- 
2023 Q3
1
3 171 
0
--- 
2022 Q4
1
2 139 
0
--- 
2022 Q1
0
--- 
1
656 
2021 Q4
1
560 
0
--- 
2021 Q3
3
2 440 
0
--- 
2021 Q1
1
1 712 
0
--- 
2020 Q4
4
1 214 
1
673 
2020 Q3
3
1 450 
0
--- 
2020 Q1
1
1 742 
0
--- 
2019 Q4
1
884 
1
1 714 
2019 Q3
4
2 028 
0
--- 
2019 Q2
1
1 890 
0
--- 
2019 Q1
3
1 604 
0
--- 
2018 Q4
1
1 680 
0
--- 
2018 Q3
3
1 691 
0
--- 
2018 Q2
1
1 157 
0
--- 
2017 Q4
2
1 254 
0
--- 
2017 Q3
3
1 839 
0
--- 
2017 Q2
1
1 638 
0
--- 
2017 Q1
3
1 659 
0
--- 
2016 Q3
1
434 
0
--- 
2016 Q2
0
--- 
1
1 606 
2016 Q1
2
1 246 
0
--- 
2015 Q3
1
1 662 
0
--- 
2015 Q2
2
1 410 
0
--- 
2015 Q1
1
1 044 
0
--- 
2014 Q4
0
--- 
1
1 488 
2014 Q3
1
1 188 
0
--- 
2014 Q1
1
2 500 
0
--- 

Overview of the latest real estate transactions

The following list is an anonymized overview of the latest transactions. For more details and to find all transactions, please use the map to view transactions by plot or the transaction search page for a search by criteria.

2025-04-09
175 000 
1 768  /m²(99 m²)
Sale
Houses
House
4 rooms
99 m2
Land
333 m2
-Sols
2025-03-07
340 000 
130  /m²(2613 m²)
Sale
Commercial property
1492 m2
Commercial property
1121 m2
2025-03-04
134 000 
1 558  /m²(86 m²)
Sale
Houses
House
3 rooms
86 m2
Land
445 m2
-Sols
Land
180 m2
-Jardins
/Jardin potager
2025-02-28
240 500 
1 670  /m²(144 m²)
Sale
Houses
House
5 rooms
144 m2
Land
420 m2
-Sols
Land
805 m2
-Jardins
/Jardin potager
2025-01-28
585 648 
114  /m²(5139 m²)
Sale
Commercial property
1947 m2
Commercial property
1121 m2
Commercial property
1492 m2
Commercial property
579 m2
Land
597 m2
-Sols
Land
906 m2
-Prés
Land
3355 m2
-Prés
Land
1338 m2
-Sols
2025-01-28
712 744 
366  /m²(1947 m²)
Sale
Commercial property
1947 m2
2024-09-27
200 000 
772  /m²(259 m²)
Sale
Houses
House
6 rooms
259 m2
Land
6752 m2
-Sols
2024-09-27
10 000 
Sale
Land
894 m2
-Terres
Land
16842 m2
-Terres
2024-09-05
130 000 
1 215  /m²(107 m²)
Sale
Houses
House
5 rooms
107 m2
Land
600 m2
-Sols
2024-08-13
213 000 
2 196  /m²(97 m²)
Sale
Houses
House
5 rooms
97 m2
Land
452 m2
-Sols
2024-07-19
820 210 
Sale
Land
27487 m2
-Terrains à bâtir
Land
6561 m2
-Terrains à bâtir
2024-07-18
820 210 
Sale
Land
27487 m2
-Terrains à bâtir
Land
6561 m2
-Terrains à bâtir
2024-06-13
138 694 
Sale
Land
4059 m2
-Terrains à bâtir
Land
534 m2
-Sols
Land
772 m2
-Sols
Land
434 m2
-Sols
2024-05-31
350 000 
1 029  /m²(340 m²)
Sale
Commercial property
340 m2
Land
363 m2
-Sols
Land
6344 m2
-Sols
2024-02-15
147 250 
1 618  /m²(91 m²)
Sale
Houses
House
3 rooms
91 m2
Land
532 m2
-Sols
2023-11-17
210 000 
833  /m²(252 m²)
Sale
Commercial property
252 m2
Land
974 m2
-Sols
2023-11-15
1 020 420 
2 362  /m²(432 m²)
Sale
Commercial property
432 m2
Land
2884 m2
-Sols
Land
224 m2
-Sols
2023-09-14
1 0
Sale
Commercial property
1828 m2
Land
8783 m2
-Sols
2023-09-11
260 000 
3 171  /m²(82 m²)
Sale
Houses
House
5 rooms
82 m2
1 outbuilding
Land
244 m2
-Sols
2023-05-16
60 000 
Sale
Land
606 m2
-Sols
133 transactions listed in the municipality

Meurthe-et-Moselle (54)

Most expensive cities

City
name
Descending orderHouses
house
Price per m²
3 544 
3 090 
2 984 
2 863 
2 824 
2 754 
2 724 
2 659 
2 633 
City
name
Descending orderApartments
apt.
Price per m²
3 571 
3 344 
2 819 
2 644 
2 641 
2 614 
2 558 
2 458 

Least expensive cities

City
name
Ascending orderHouses
house
Price per m²
259 
280 
320 
395 
412 
448 
448 
468 
City
name
Ascending orderApartments
apt.
Price per m²
157 
167 
169 
169 
245 
247 
261