emooki
HomePrice mapTransactions
🇬🇧 English🇫🇷 Français🇩🇪 Deutsch🇪🇸 Español🇮🇹 Italiano

Real estate price map


Real estate price map in the municipality of Crévic.

Meurthe-et-Moselle (54)
Crévic

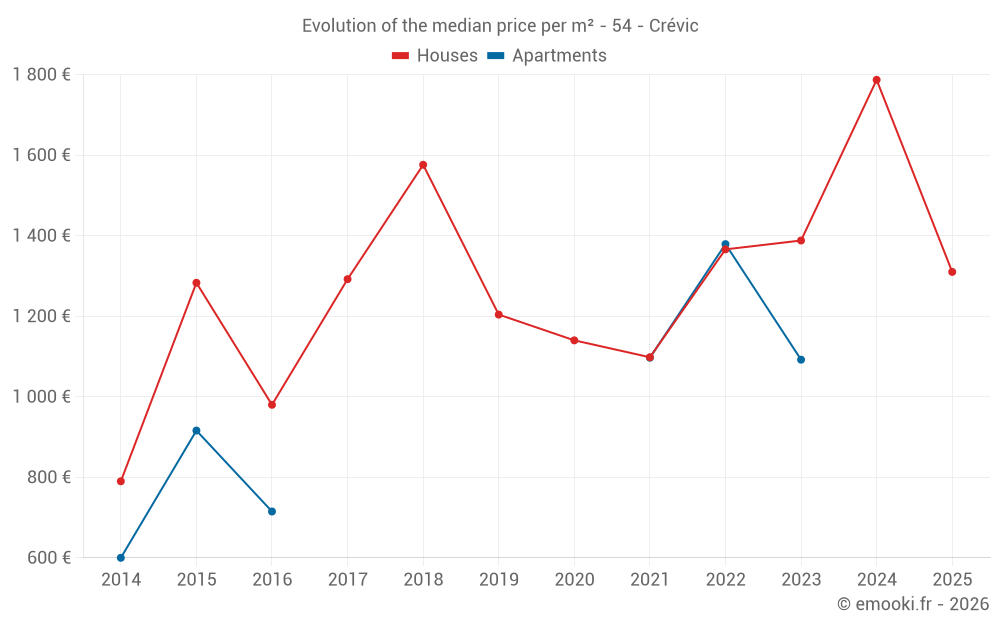
Median price of real estate
in the municipality of Crévic

HousesHouses
1 512  /m²
1-23-45-67-89-10
Reliability 6/10
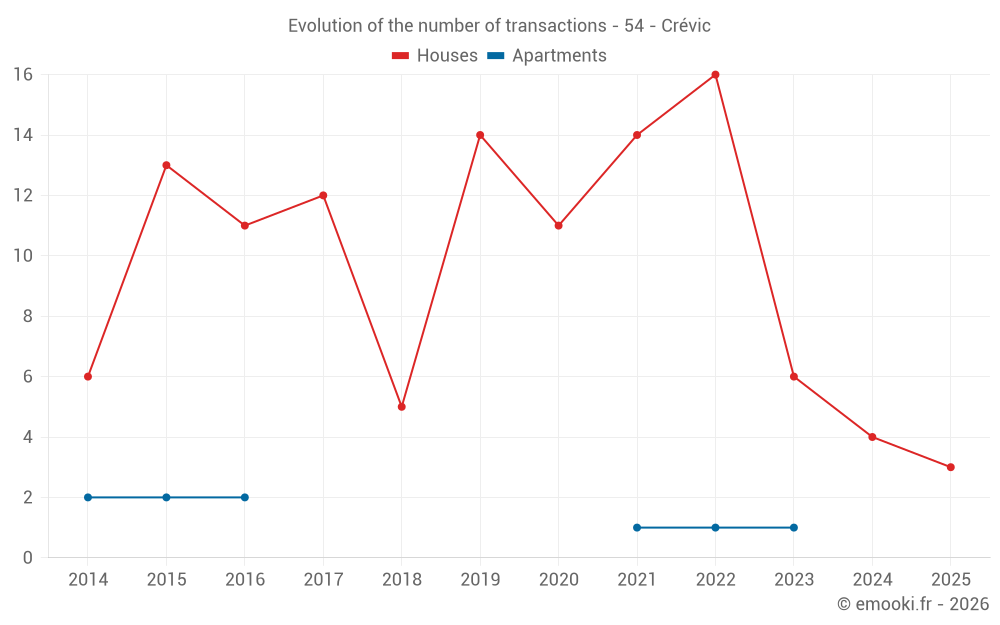
Median price on the 20 transactions of the last 36 months.
from 972 to
1 993  /m²
60% of transactions from the 2nd to the 8th deciles.
ApartmentsApartments
1 076  /m²
1-23-45-67-89-10
Reliability 1/10
Median price on the 6 transactions of the last 120 months.
DwellingsDwellings
1 442  /m²
1-23-45-67-89-10
Reliability 6/10
Median price on the 22 transactions of the last 36 months.
from 1 023 to
1 932  /m²
60% of transactions from the 2nd to the 8th deciles.
HousesEvolution of the price per m² of houses since...
1 year
--
2 years
--
3 years
--
4 years
--
5 years
--
6 years
--
7 years
--
8 years
--
9 years
--
10 years
--
11 years
--
ApartmentsEvolution of the price per m² of apartments since...
1 year
--
2 years
--
3 years
--
4 years
--
5 years
--
6 years
--
7 years
--
8 years
--
9 years
--
10 years
--
11 years
--

Yearly evolution

Evolution of the median price per m²

Evolution of the number of transactions

Warning, last year incomplete. Projections made based on the proportions between semesters of the previous year at the departmental/national level and by type of property.

Yearly data

Descending order
Year
Houses
house
transactions
Houses
house
Price per m²
Apartments
apt.
transactions
Apartments
apt.
Price per m²
2025
3
1 310 
0
--- 
2024
4
1 787 
0
--- 
2023
6
1 388 
1
1 092 
2022
16
1 366 
1
1 379 
2021
14
1 098 
1
1 097 
2020
11
1 140 
0
--- 
2019
14
1 204 
0
--- 
2018
5
1 576 
0
--- 
2017
12
1 292 
0
--- 
2016
11
980 
2
715 
2015
13
1 283 
2
916 
2014
6
790 
2
600 

Analysis

Structure of prices per m²

Values of price percentiles per m² over the periods used for the estimated price of each type of property.

Structure of transaction amounts

Values of transaction amounts percentiles over the periods used for the estimated price of each type of property.

Transaction amounts and prices per m² by percentile

Ascending order
Percentile
Houses
house
Price per m²
Houses
house
Transaction amount
Apartments
apt.
Price per m²
Apartments
apt.
Transaction amount
10th percentile
727 
80 000 
715 
97 288 
20th percentile
972 
116 K
719 
120 K
30th percentile
1 086 
132 K
890 
124 K
40th percentile
1 328 
145 K
1 061 
128 K
50th percentile
1 512 
155 K
1 076 
134 K
60th percentile
1 643 
182 K
1 092 
140 K
70th percentile
1 750 
254 K
1 094 
161 K
80th percentile
1 993 
263 K
1 097 
182 K
90th percentile
2 604 
278 K
1 238 
192 K

National and departmental comparison

Evolution of the median price per m² of houses

Evolution of the median price per m² of apartments

Quarterly evolution

Evolution of the median price per m²

Evolution of the number of transactions

Quarterly data

Descending order
Quarter
Houses
house
transactions
Houses
house
Price per m²
Apartments
apt.
transactions
Apartments
apt.
Price per m²
2025 Q2
1
1 974 
0
--- 
2025 Q1
2
1 166 
0
--- 
2024 Q3
3
2 069 
0
--- 
2024 Q1
1
417 
0
--- 
2023 Q4
1
3 058 
0
--- 
2023 Q3
2
904 
0
--- 
2023 Q2
1
2 624 
0
--- 
2023 Q1
2
1 196 
1
1 092 
2022 Q4
5
1 340 
1
1 379 
2022 Q3
2
1 582 
0
--- 
2022 Q2
6
1 118 
0
--- 
2022 Q1
3
1 440 
0
--- 
2021 Q4
2
1 571 
0
--- 
2021 Q3
8
913 
0
--- 
2021 Q2
3
1 075 
0
--- 
2021 Q1
1
2 012 
1
1 097 
2020 Q4
4
1 956 
0
--- 
2020 Q3
3
1 111 
0
--- 
2020 Q2
3
779 
0
--- 
2020 Q1
1
904 
0
--- 
2019 Q4
2
1 350 
0
--- 
2019 Q3
4
1 320 
0
--- 
2019 Q2
3
560 
0
--- 
2019 Q1
5
1 020 
0
--- 
2018 Q3
2
970 
0
--- 
2018 Q1
3
1 893 
0
--- 
2017 Q4
2
1 598 
0
--- 
2017 Q3
4
1 560 
0
--- 
2017 Q2
2
1 376 
0
--- 
2017 Q1
4
1 004 
0
--- 
2016 Q4
3
908 
0
--- 
2016 Q3
4
1 678 
2
715 
2016 Q2
4
1 064 
0
--- 
2015 Q4
4
1 510 
1
1 061 
2015 Q3
4
1 036 
0
--- 
2015 Q2
3
1 200 
0
--- 
2015 Q1
2
1 369 
1
772 
2014 Q4
0
--- 
2
600 
2014 Q3
2
1 147 
0
--- 
2014 Q2
2
576 
0
--- 
2014 Q1
2
1 222 
0
--- 

Meurthe-et-Moselle (54)

Most expensive cities

City
name
Descending orderHouses
house
Price per m²
3 544 
3 090 
2 984 
2 863 
2 824 
2 754 
2 724 
2 659 
2 633 
City
name
Descending orderApartments
apt.
Price per m²
3 571 
3 344 
2 819 
2 644 
2 641 
2 614 
2 558 
2 458 

Least expensive cities

City
name
Ascending orderHouses
house
Price per m²
259 
280 
320 
395 
412 
448 
448 
468 
City
name
Ascending orderApartments
apt.
Price per m²
157 
167 
169 
169 
245 
247 
261