emooki
HomePrice mapTransactions
🇬🇧 English🇫🇷 Français🇩🇪 Deutsch🇪🇸 Español🇮🇹 Italiano

Real estate price map


Real estate price map in the municipality of Saint-Brisson-sur-Loire, choose a section to see transactions by parcel.

Loiret (45)

Saint-Brisson-sur-Loire - Real estate price m²

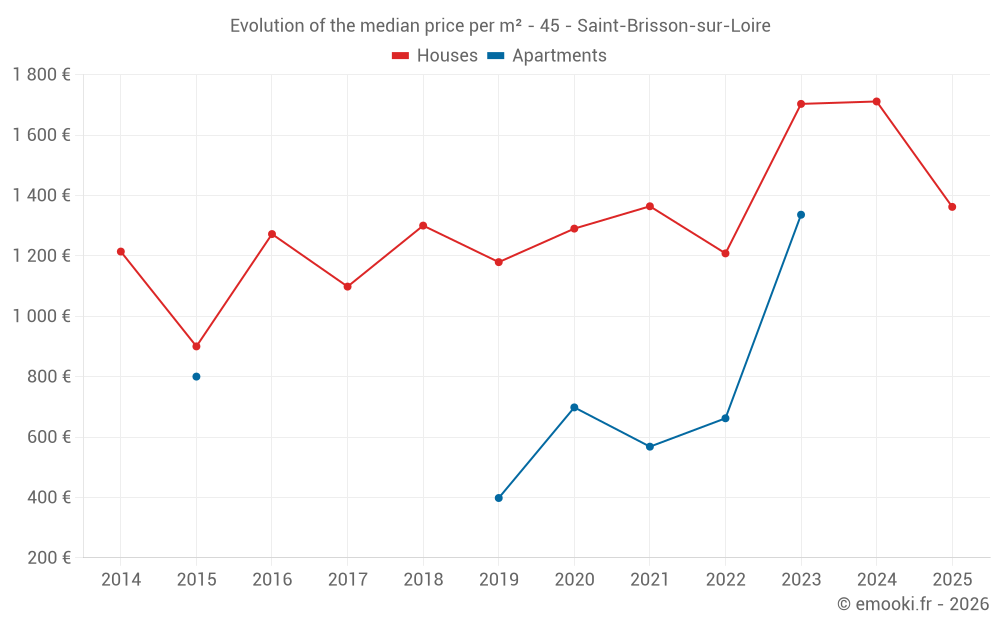
Median price of real estate
in the municipality of Saint-Brisson-sur-Loire

HousesHouses
1 544  /m²
1-23-45-67-89-10
Reliability 7/10
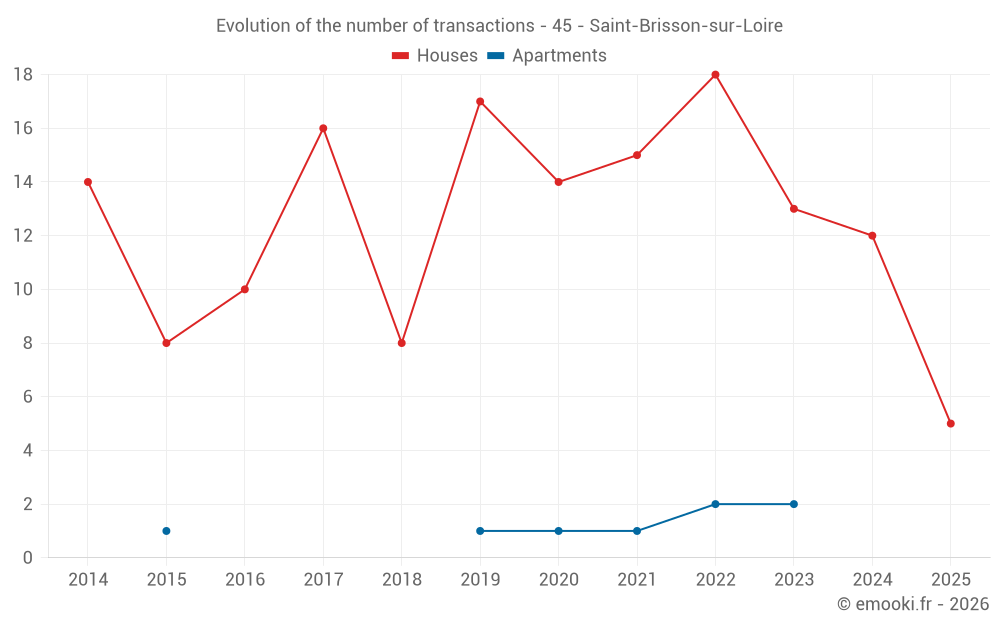
Median price on the 24 transactions of the last 24 months.
from 1 097 to
1 943  /m²
60% of transactions from the 2nd to the 8th deciles.
ApartmentsApartments
698  /m²
1-23-45-67-89-10
Reliability 3/10
Median price on the 7 transactions of the last 72 months.
DwellingsDwellings
1 497  /m²
1-23-45-67-89-10
Reliability 7/10
Median price on the 25 transactions of the last 24 months.
from 1 082 to
1 909  /m²
60% of transactions from the 2nd to the 8th deciles.
HousesEvolution of the price per m² of houses since...
1 year
-20%
2 years
-20%
3 years
+13%
4 years
-0.1%
5 years
+5.6%
6 years
+16%
7 years
+4.8%
8 years
+24%
9 years
+7.1%
10 years
+51%
11 years
+12%
The price per m² of houses has decreased by 20% since 1 year, but it has increased by 51% in 10 years.

Yearly evolution

Evolution of the median price per m²

Evolution of the median price per m² - 45 - Saint-Brisson-sur-Loire

Evolution of the number of transactions

Warning, last year incomplete. Projections made based on the proportions between semesters of the previous year at the departmental/national level and by type of property.

Evolution of the number of transactions - 45 - Saint-Brisson-sur-Loire

Yearly data

Descending order
Year
Houses
house
transactions
Houses
house
Price per m²
Apartments
apt.
transactions
Apartments
apt.
Price per m²
2025
5
1 362 
0
--- 
2024
12
1 711 
0
--- 
2023
13
1 703 
2
1 336 
2022
18
1 208 
2
662 
2021
15
1 364 
1
568 
2020
14
1 290 
1
698 
2019
17
1 179 
1
398 
2018
8
1 300 
0
--- 
2017
16
1 098 
0
--- 
2016
10
1 272 
0
--- 
2015
8
900 
1
800 
2014
14
1 214 
0
--- 

Analysis

Structure of prices per m²

Values of price percentiles per m² over the periods used for the estimated price of each type of property.

Structure of transaction amounts

Values of transaction amounts percentiles over the periods used for the estimated price of each type of property.

Transaction amounts and prices per m² by percentile

Ascending order
Percentile
Houses
house
Price per m²
Houses
house
Transaction amount
Apartments
apt.
Price per m²
Apartments
apt.
Transaction amount
10th percentile
827 
50 000 
500 
36 200 
20th percentile
1 097 
73 132 
576 
39 398 
30th percentile
1 279 
82 050 
602 
46 592 
40th percentile
1 366 
103 K
645 
49 394 
50th percentile
1 544 
128 K
698 
50 000 
60th percentile
1 688 
137 K
708 
53 000 
70th percentile
1 795 
156 K
753 
62 000 
80th percentile
1 943 
183 K
868 
83 000 
90th percentile
2 192 
216 K
1 250 
94 000 

National and departmental comparison

Evolution of the median price per m² of houses

Evolution of the median price per m² of apartments

Quarterly evolution

Evolution of the median price per m²

Evolution of the number of transactions

Quarterly data

Descending order
Quarter
Houses
house
transactions
Houses
house
Price per m²
Apartments
apt.
transactions
Apartments
apt.
Price per m²
2025 Q2
1
1 100 
0
--- 
2025 Q1
4
1 371 
0
--- 
2024 Q4
4
2 187 
0
--- 
2024 Q3
4
1 692 
0
--- 
2024 Q2
3
735 
0
--- 
2024 Q1
1
1 630 
0
--- 
2023 Q4
5
1 750 
0
--- 
2023 Q3
2
1 390 
1
907 
2023 Q2
1
210 
1
1 765 
2023 Q1
5
1 820 
0
--- 
2022 Q4
10
1 238 
1
714 
2022 Q3
3
1 087 
0
--- 
2022 Q2
4
1 447 
0
--- 
2022 Q1
1
764 
1
610 
2021 Q4
3
1 869 
1
568 
2021 Q3
6
1 341 
0
--- 
2021 Q2
4
1 520 
0
--- 
2021 Q1
2
1 266 
0
--- 
2020 Q4
4
1 056 
0
--- 
2020 Q3
3
1 714 
0
--- 
2020 Q2
3
1 063 
1
698 
2020 Q1
4
1 290 
0
--- 
2019 Q4
4
1 228 
0
--- 
2019 Q3
5
583 
1
398 
2019 Q2
5
1 267 
0
--- 
2019 Q1
3
1 179 
0
--- 
2018 Q4
2
1 056 
0
--- 
2018 Q3
2
1 312 
0
--- 
2018 Q2
2
1 317 
0
--- 
2018 Q1
2
1 631 
0
--- 
2017 Q4
5
985 
0
--- 
2017 Q3
5
1 136 
0
--- 
2017 Q2
4
924 
0
--- 
2017 Q1
2
1 734 
0
--- 
2016 Q4
4
1 420 
0
--- 
2016 Q3
1
1 106 
0
--- 
2016 Q2
4
1 272 
0
--- 
2016 Q1
1
1 130 
0
--- 
2015 Q4
1
775 
0
--- 
2015 Q3
3
417 
0
--- 
2015 Q2
1
464 
0
--- 
2015 Q1
3
1 465 
1
800 
2014 Q4
1
291 
0
--- 
2014 Q3
6
1 294 
0
--- 
2014 Q2
5
880 
0
--- 
2014 Q1
2
1 362 
0
--- 

Overview of the latest real estate transactions

The following list is an anonymized overview of the latest transactions. For more details and to find all transactions, please use the map to view transactions by plot or the transaction search page for a search by criteria.

2025-05-28
82 500 
1 100  /m²(75 m²)
Sale
Houses
House
3 rooms
75 m2
Land
646 m2
-Sols
2025-03-27
35 000 
1 591  /m²(22 m²)
Sale
Houses
House
1 room
22 m2
Land
355 m2
-Sols
2025-03-21
4 335 
Sale
Land
1706 m2
-Prés
Land
4465 m2
-Peupleraies
2025-02-05
3 000 
Sale
Land
879 m2
-Terres
Land
3476 m2
-Taillis simples
Land
2851 m2
-Taillis simples
2025-01-30
68 080 
1 362  /m²(50 m²)
Sale
Houses
House
3 rooms
50 m2
2 outbuildings
Land
1819 m2
-Sols
2025-01-16
139 400 
1 380  /m²(101 m²)
Sale
Houses
House
4 rooms
101 m2
Land
3297 m2
-Terrains d'agrément
Land
400 m2
-Sols
Land
1416 m2
-Terres
2025-01-15
76 500 
1 093  /m²(70 m²)
Sale
Houses
House
4 rooms
70 m2
Land
299 m2
-Sols
2024-11-25
165 000 
2 357  /m²(70 m²)
Sale
Houses
House
4 rooms
70 m2
1 outbuilding
Land
368 m2
-Sols
Land
16 m2
-Sols
2024-10-29
15 890 
Sale
Land
8728 m2
-Prés
Land
30997 m2
-Terres
2024-10-24
50 000 
Sale
3 outbuildings
Land
86 m2
-Sols
2024-10-24
138 000 
1 792  /m²(77 m²)
Sale
Land
117 m2
-Terres
Houses
House
3 rooms
77 m2
3 outbuildings
Land
1448 m2
-Terres
Land
400 m2
-Sols
2024-10-11
50 000 
2 174  /m²(23 m²)
Sale
Houses
House
1 room
23 m2
1 outbuilding
Land
362 m2
-Sols
2024-10-10
500 
Sale
Land
1419 m2
-Terres
2024-10-01
330 000 
2 200  /m²(150 m²)
Sale
Houses
House
4 rooms
150 m2
1 outbuilding
Land
7500 m2
-Sols
2024-09-18
78 000 
1 040  /m²(75 m²)
Sale
Houses
House
4 rooms
75 m2
2 outbuildings
Land
2168 m2
-Terres
Land
384 m2
-Sols
2024-08-29
70 000 
272  /m²(257 m²)
1 167  /m²(60 m²)
Sale
Houses
House
2 rooms
60 m2
Land
70 m2
-Sols
Commercial property
197 m2
Land
52 m2
-Sols
Land
84 m2
-Sols
2024-08-23
225 000 
2 813  /m²(80 m²)
Sale
Land
216 m2
-Terrains d'agrément
Houses
House
3 rooms
80 m2
2 outbuildings
Land
1956 m2
-Terrains d'agrément
Land
500 m2
-Sols
2024-07-19
116 500 
1 339  /m²(87 m²)
Sale
Houses
House
4 rooms
87 m2
Land
990 m2
-Jardins
Land
1012 m2
-Sols
2024-07-17
45 000 
Sale
Land
12309 m2
-Terres
Land
100 m2
-Sols
2024-07-11
196 350 
2 045  /m²(96 m²)
Sale
Houses
House
4 rooms
96 m2
Land
537 m2
-Terrains d'agrément
Land
500 m2
-Sols
273 transactions listed in the municipality

Loiret (45)

Most expensive cities

City
name
Descending orderHouses
house
Price per m²
3 031 
2 608 
2 604 
2 397 
City
name
Descending orderApartments
apt.
Price per m²
3 050 
2 904 
2 606 
2 497 
2 436 
2 408 

Least expensive cities

City
name
Ascending orderHouses
house
Price per m²
713 
768 
927 
City
name
Ascending orderApartments
apt.
Price per m²
274 
349 
385 
483 
495 
538