emooki
HomePrice mapTransactions
🇬🇧 English🇫🇷 Français🇩🇪 Deutsch🇪🇸 Español🇮🇹 Italiano

Real estate price map


Real estate price map in the municipality of Saint-Jean-le-Blanc, choose a section to see transactions by parcel.

Loiret (45)
Saint-Jean-le-Blanc

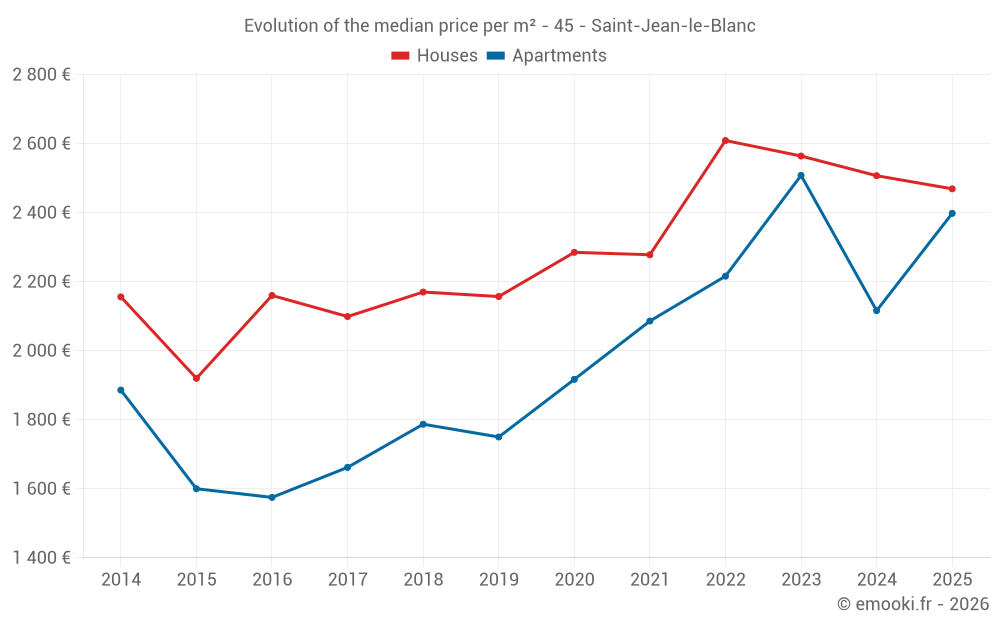
Median price of real estate
in the municipality of Saint-Jean-le-Blanc

HousesHouses
2 466 € /m²
1-23-45-67-89-10
Reliability 8/10
Median price on the 56 transactions of the last 12 months.
from 2 230 to
2 803 € /m²
60% of transactions from the 2nd to the 8th deciles.
ApartmentsApartments
2 398 € /m²
1-23-45-67-89-10
Reliability 9/10
Median price on the 29 transactions of the last 6 months.
from 1 917 to
3 237 € /m²
60% of transactions from the 2nd to the 8th deciles.
DwellingsDwellings
2 452 € /m²
1-23-45-67-89-10
Reliability 9/10
Median price on the 46 transactions of the last 6 months.
from 2 015 to
3 205 € /m²
60% of transactions from the 2nd to the 8th deciles.
HousesEvolution of the price per m² of houses since...
1 year
-1.5%
2 years
-3.7%
3 years
-5.4%
4 years
+8.4%
5 years
+8.1%
6 years
+14%
7 years
+14%
8 years
+18%
9 years
+14%
10 years
+29%
11 years
+15%
The price per m² of houses has decreased by 5.4% since 3 years, but it has increased by 29% in 10 years.
ApartmentsEvolution of the price per m² of apartments since...
1 year
+13%
2 years
-4.4%
3 years
+8.2%
4 years
+15%
5 years
+25%
6 years
+37%
7 years
+34%
8 years
+44%
9 years
+52%
10 years
+50%
11 years
+27%
The price per m² of apartments has decreased by 4.4% since 2 years, but it has increased by 52% in 9 years.

Yearly evolution

Evolution of the median price per m²

Evolution of the number of transactions

Warning, last year incomplete. Projections made based on the proportions between semesters of the previous year at the departmental/national level and by type of property.

Yearly data

Descending order
Year
Houses
house
transactions
Houses
house
Price per m²
Apartments
apt.
transactions
Apartments
apt.
Price per m²
2025
17
2 469 €
29
2 398 €
2024
57
2 507 €
46
2 116 €
2023
60
2 564 €
74
2 508 €
2022
67
2 609 €
91
2 216 €
2021
80
2 278 €
88
2 086 €
2020
70
2 285 €
77
1 917 €
2019
78
2 157 €
79
1 750 €
2018
88
2 170 €
75
1 787 €
2017
63
2 099 €
81
1 662 €
2016
69
2 160 €
83
1 575 €
2015
66
1 920 €
60
1 600 €
2014
60
2 156 €
55
1 886 €

Analysis

Structure of prices per m²

Values of price percentiles per m² over the periods used for the estimated price of each type of property.

Structure of transaction amounts

Values of transaction amounts percentiles over the periods used for the estimated price of each type of property.

Transaction amounts and prices per m² by percentile

Ascending order
Percentile
Houses
house
Price per m²
Houses
house
Transaction amount
Apartments
apt.
Price per m²
Apartments
apt.
Transaction amount
10th percentile
2 000 €
162 K€
1 809 €
77 863 €
20th percentile
2 230 €
203 K€
1 917 €
87 800 €
30th percentile
2 316 €
225 K€
2 080 €
99 114 €
40th percentile
2 402 €
244 K€
2 143 €
107 K€
50th percentile
2 466 €
290 K€
2 398 €
120 K€
60th percentile
2 545 €
308 K€
2 539 €
140 K€
70th percentile
2 701 €
333 K€
2 799 €
145 K€
80th percentile
2 803 €
374 K€
3 237 €
207 K€
90th percentile
3 090 €
449 K€
3 476 €
231 K€

National and departmental comparison

Evolution of the median price per m² of houses

Evolution of the median price per m² of apartments

Quarterly evolution

Evolution of the median price per m²

Evolution of the number of transactions

Quarterly data

Descending order
Quarter
Houses
house
transactions
Houses
house
Price per m²
Apartments
apt.
transactions
Apartments
apt.
Price per m²
2025 Q2
5
2 507 €
7
3 221 €
2025 Q1
12
2 368 €
22
2 226 €
2024 Q4
24
2 436 €
11
1 984 €
2024 Q3
15
2 488 €
10
2 676 €
2024 Q2
9
2 850 €
16
2 143 €
2024 Q1
9
2 063 €
9
2 241 €
2023 Q4
13
2 538 €
15
2 654 €
2023 Q3
18
2 586 €
20
2 508 €
2023 Q2
15
2 563 €
21
2 200 €
2023 Q1
14
2 610 €
18
2 584 €
2022 Q4
16
2 860 €
20
2 016 €
2022 Q3
21
2 486 €
24
2 256 €
2022 Q2
17
2 756 €
23
2 172 €
2022 Q1
13
2 184 €
24
2 336 €
2021 Q4
17
2 266 €
23
2 089 €
2021 Q3
25
2 481 €
31
1 895 €
2021 Q2
22
2 267 €
21
2 073 €
2021 Q1
16
2 216 €
13
2 431 €
2020 Q4
32
2 422 €
21
1 841 €
2020 Q3
18
2 302 €
19
2 094 €
2020 Q2
12
2 164 €
21
1 900 €
2020 Q1
8
1 796 €
16
1 970 €
2019 Q4
22
2 188 €
22
1 785 €
2019 Q3
16
2 173 €
24
1 638 €
2019 Q2
18
2 124 €
21
1 929 €
2019 Q1
22
2 138 €
12
1 956 €
2018 Q4
17
2 173 €
18
1 803 €
2018 Q3
31
2 163 €
21
1 787 €
2018 Q2
18
2 194 €
19
1 878 €
2018 Q1
22
2 308 €
17
1 743 €
2017 Q4
14
2 154 €
16
1 607 €
2017 Q3
19
2 010 €
20
1 938 €
2017 Q2
16
2 080 €
25
1 540 €
2017 Q1
14
2 266 €
20
1 560 €
2016 Q4
24
2 206 €
28
1 524 €
2016 Q3
20
2 073 €
20
1 711 €
2016 Q2
18
2 170 €
22
1 562 €
2016 Q1
7
2 524 €
13
1 500 €
2015 Q4
21
1 831 €
13
1 515 €
2015 Q3
20
1 878 €
15
1 500 €
2015 Q2
12
2 074 €
19
1 667 €
2015 Q1
13
2 141 €
13
1 739 €
2014 Q4
17
2 069 €
19
1 920 €
2014 Q3
19
2 333 €
11
1 761 €
2014 Q2
9
2 137 €
14
2 076 €
2014 Q1
15
2 218 €
11
1 600 €

Overview of the latest real estate transactions

The following list is an anonymized overview of the latest transactions. For more details and to find all transactions, please use the map to view transactions by plot or the transaction search page for a search by criteria.

2025-06-02
340 000 €
2 556 € /m²(133 m²)
Sale
Houses
House
5 rooms
133 m2
Land
668 m2
-Sols
2025-05-28
800 000 €
390 € /m²(2050 m²)
Sale
Commercial property
2050 m2
Land
3698 m2
-Sols
2025-05-28
530 000 €
4 141 € /m²(128 m²)
Sale
Houses
House
3 rooms
128 m2
Land
657 m2
-Sols
2025-05-23
140 000 €
2 121 € /m²(66 m²)
Sale
2 outbuildings
Apartments
Apartment
3 rooms
66 m2
1 outbuilding
2025-05-21
335 000 €
2 463 € /m²(136 m²)
Sale
Houses
House
8 rooms
136 m2
Land
703 m2
-Sols
2025-05-21
397 000 €
4 269 € /m²(93 m²)
Sale
Apartments
Apartment
4 rooms
93 m2
4 outbuildings
2025-05-20
235 500 €
2 453 € /m²(96 m²)
Sale
Apartments
Apartment
4 rooms
96 m2
1 outbuilding
2025-05-20
219 000 €
3 221 € /m²(68 m²)
Sale
Apartments
Apartment
3 rooms
68 m2
1 outbuilding
2025-05-15
200 540 €
2 507 € /m²(80 m²)
Sale
Houses
House
5 rooms
80 m2
Land
400 m2
-Sols
Land
1427 m2
-Sols
2025-05-14
50 000 €
Sale
Land
1792 m2
-Sols
2025-05-12
215 000 €
Sale
Land
167 m2
-Sols
2025-05-06
149 000 €
4 967 € /m²(30 m²)
Sale
Apartments
Apartment
1 room
30 m2
2 outbuildings
2025-05-05
215 000 €
2 108 € /m²(102 m²)
Sale
Houses
House
5 rooms
102 m2
Land
616 m2
-Sols
Land
2992 m2
-Sols
Land
736 m2
-Sols
2025-04-30
91 000 €
1 857 € /m²(49 m²)
Sale
Apartments
Apartment
2 rooms
49 m2
2 outbuildings
2025-04-29
919 025 €
399 € /m²(2301 m²)
Sale
Commercial property
2301 m2
Land
4396 m2
-Sols
2025-04-28
180 000 €
994 € /m²(181 m²)
1 488 € /m²(121 m²)
Sale
Houses
House
5 rooms
121 m2
Commercial property
60 m2
2025-04-28
199 000 €
3 262 € /m²(61 m²)
Sale
Apartments
Apartment
3 rooms
61 m2
1 outbuilding
2025-04-18
21 000 €
Sale
1 outbuilding
2025-03-31
203 000 €
2 900 € /m²(70 m²)
Sale
Houses
House
3 rooms
70 m2
Land
271 m2
-Sols
2025-03-28
29 000 €
1 074 € /m²(27 m²)
Sale
Apartments
Apartment
3 rooms
27 m2
2 outbuildings
2332 transactions listed in the municipality

Loiret (45)

Most expensive cities

City
name
Descending orderHouses
house
Price per m²
3 031 €
2 608 €
2 604 €
2 526 €
2 486 €
2 466 €
2 434 €
2 416 €
2 397 €
2 388 €
City
name
Descending orderApartments
apt.
Price per m²
3 050 €
2 904 €
2 879 €
2 819 €
2 739 €
2 642 €
2 606 €
2 497 €
2 436 €
2 408 €

Least expensive cities

City
name
Ascending orderHouses
house
Price per m²
713 €
754 €
768 €
833 €
874 €
889 €
927 €
968 €
City
name
Ascending orderApartments
apt.
Price per m²
224 €
274 €
348 €
349 €
385 €
483 €
495 €
538 €