emooki

Real estate price map


Real estate price map in the municipality of Fay-aux-Loges, choose a section to see transactions by parcel.

Loiret (45)

Price per m² in Fay-aux-Loges

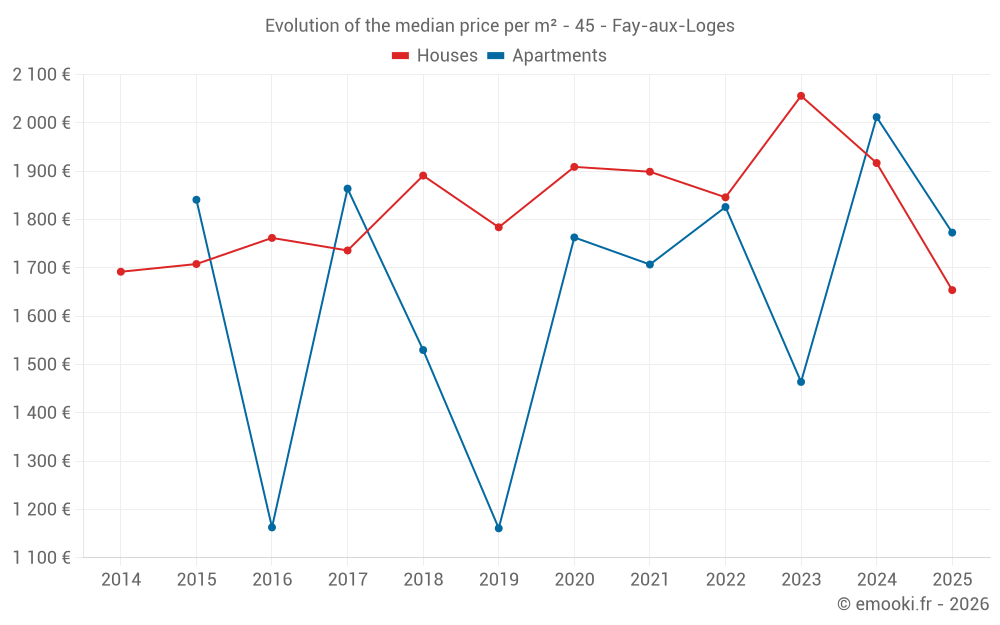
Median price of real estate
in the municipality of Fay-aux-Loges

HousesHouses
1 852  /m²
1-23-45-67-89-10
Reliability 8/10
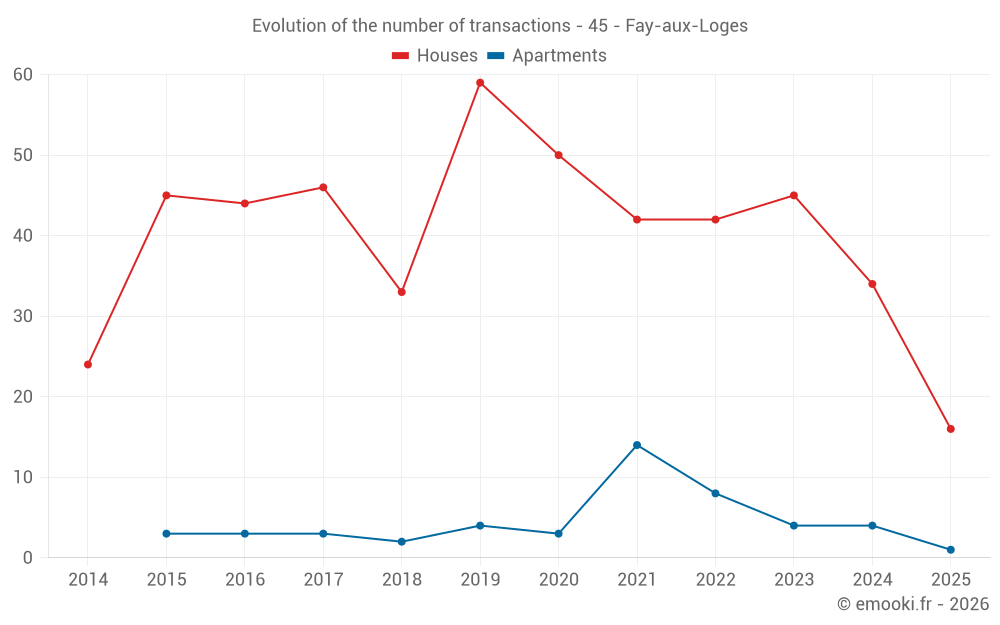
Median price on the 36 transactions of the last 12 months.
from 1 094 to
2 184  /m²
60% of transactions from the 2nd to the 8th deciles.
ApartmentsApartments
1 776  /m²
1-23-45-67-89-10
Reliability 5/10
Median price on the 25 transactions of the last 48 months.
from 1 533 to
2 023  /m²
60% of transactions from the 2nd to the 8th deciles.
DwellingsDwellings
1 852  /m²
1-23-45-67-89-10
Reliability 8/10
Median price on the 38 transactions of the last 12 months.
from 1 228 to
2 172  /m²
60% of transactions from the 2nd to the 8th deciles.
HousesEvolution of the price per m² of houses since...
1 year
-14%
2 years
-20%
3 years
-10%
4 years
-13%
5 years
-13%
6 years
-7.3%
7 years
-13%
8 years
-4.7%
9 years
-6.1%
10 years
-3.2%
11 years
-2.2%

894 transactions listed in the municipality

Yearly evolution

Evolution of the median price per m²

Evolution of the median price per m² - 45 - Fay-aux-Loges

Evolution of the number of transactions

Warning, last year incomplete. Projections made based on the proportions between semesters of the previous year at the departmental/national level and by type of property.

Evolution of the number of transactions - 45 - Fay-aux-Loges

Yearly data

Descending order
Year
Houses
house
transactions
Houses
house
Price per m²
Apartments
apt.
transactions
Apartments
apt.
Price per m²
2025
16
1 654 
1
1 773 
2024
34
1 917 
4
2 012 
2023
45
2 056 
4
1 464 
2022
42
1 846 
8
1 826 
2021
42
1 899 
14
1 707 
2020
50
1 909 
3
1 763 
2019
59
1 784 
4
1 161 
2018
33
1 891 
2
1 530 
2017
46
1 736 
3
1 864 
2016
44
1 762 
3
1 163 
2015
45
1 708 
3
1 841 
2014
24
1 692 
0
--- 

Analysis

Structure of prices per m²

Values of price percentiles per m² over the periods used for the estimated price of each type of property.

Structure of transaction amounts

Values of transaction amounts percentiles over the periods used for the estimated price of each type of property.

Transaction amounts and prices per m² by percentile

Ascending order
Percentile
Houses
house
Price per m²
Houses
house
Transaction amount
Apartments
apt.
Price per m²
Apartments
apt.
Transaction amount
10th percentile
987 
90 000 
1 348 
74 400 
20th percentile
1 094 
110 K
1 533 
79 600 
30th percentile
1 543 
148 K
1 671 
86 400 
40th percentile
1 691 
185 K
1 752 
89 000 
50th percentile
1 852 
195 K
1 776 
93 000 
60th percentile
1 996 
205 K
1 870 
108 K
70th percentile
2 059 
218 K
2 000 
117 K
80th percentile
2 184 
240 K
2 023 
138 K
90th percentile
2 370 
298 K
2 093 
163 K

National and departmental comparison

Evolution of the median price per m² of houses

Evolution of the median price per m² of apartments

Quarterly evolution

Evolution of the median price per m²

Evolution of the number of transactions

Quarterly data

Descending order
Quarter
Houses
house
transactions
Houses
house
Price per m²
Apartments
apt.
transactions
Apartments
apt.
Price per m²
2025 Q2
1
1 429 
0
--- 
2025 Q1
15
1 691 
1
1 773 
2024 Q4
8
2 018 
1
2 000 
2024 Q3
12
1 798 
0
--- 
2024 Q2
10
1 932 
0
--- 
2024 Q1
4
1 906 
3
2 023 
2023 Q4
9
2 056 
0
--- 
2023 Q3
10
1 947 
0
--- 
2023 Q2
14
2 260 
2
1 830 
2023 Q1
12
1 961 
2
1 355 
2022 Q4
14
1 910 
2
1 644 
2022 Q3
9
1 726 
0
--- 
2022 Q2
12
2 092 
4
1 930 
2022 Q1
7
1 704 
2
1 725 
2021 Q4
9
1 715 
4
1 951 
2021 Q3
15
1 914 
4
1 690 
2021 Q2
11
1 890 
6
1 608 
2021 Q1
7
2 121 
0
--- 
2020 Q4
14
1 976 
2
1 918 
2020 Q3
16
1 810 
1
1 763 
2020 Q2
8
1 724 
0
--- 
2020 Q1
12
2 058 
0
--- 
2019 Q4
16
1 648 
1
1 409 
2019 Q3
11
1 898 
2
1 110 
2019 Q2
18
1 893 
1
1 006 
2019 Q1
14
1 626 
0
--- 
2018 Q4
11
2 143 
0
--- 
2018 Q3
11
1 929 
0
--- 
2018 Q2
8
1 668 
2
1 530 
2018 Q1
3
1 563 
0
--- 
2017 Q4
15
1 885 
3
1 864 
2017 Q3
13
1 634 
0
--- 
2017 Q2
8
1 656 
0
--- 
2017 Q1
10
1 664 
0
--- 
2016 Q4
11
1 148 
1
1 342 
2016 Q3
10
1 827 
1
725 
2016 Q2
10
1 820 
0
--- 
2016 Q1
13
1 825 
1
1 163 
2015 Q4
12
1 419 
2
1 892 
2015 Q3
14
1 752 
0
--- 
2015 Q2
11
1 940 
0
--- 
2015 Q1
8
1 708 
1
1 762 
2014 Q4
6
1 656 
0
--- 
2014 Q3
6
1 622 
0
--- 
2014 Q2
5
1 740 
0
--- 
2014 Q1
7
1 772 
0
--- 

Key takeaways

  • QuestionWhat is the price per m2 of houses in Fay-aux-Loges?

    The median price on the 36 house transactions of the last 12 months in the municipality of Fay-aux-Loges was 1 852 € per square meter for a median property value of 195 000 €. Over this period, 60% of transactions were between 1 094 and 2 184 € per square meter (from the 2nd to the 8th deciles).

Compare with neighboring municipalities

City
name
Descending orderHouses
house
Price per m²
Apartments
apt.
Price per m²
2 141 
1 883 
1 980 
1 422 
1 939 
1 152 
1 918 
1 700 
1 892 
1 113 
1 852 
1 776 
1 814 
1 810 
1 800 
--- 
1 788 
1 196 
1 731 
--- 

City information

Zip code

  • 45450 FAY AUX LOGES

Data source & update