emooki
HomePrice mapTransactions
🇬🇧 English🇫🇷 Français🇩🇪 Deutsch🇪🇸 Español🇮🇹 Italiano

Real estate price map


Real estate price map in the municipality of Château-Renard.

Loiret (45)
Château-Renard

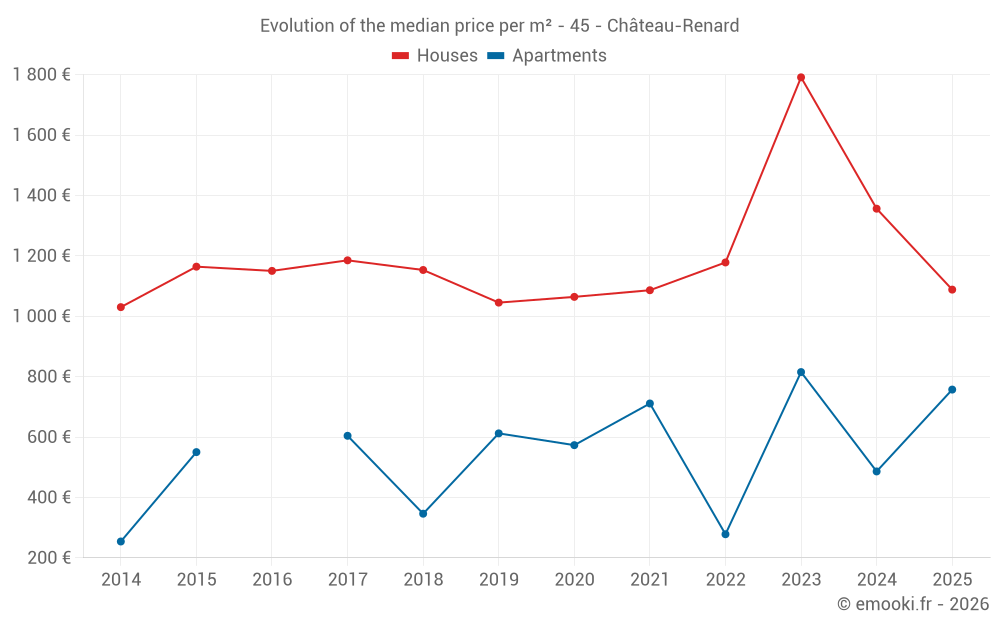
Median price of real estate
in the municipality of Château-Renard

HousesHouses
1 186  /m²
1-23-45-67-89-10
Reliability 8/10
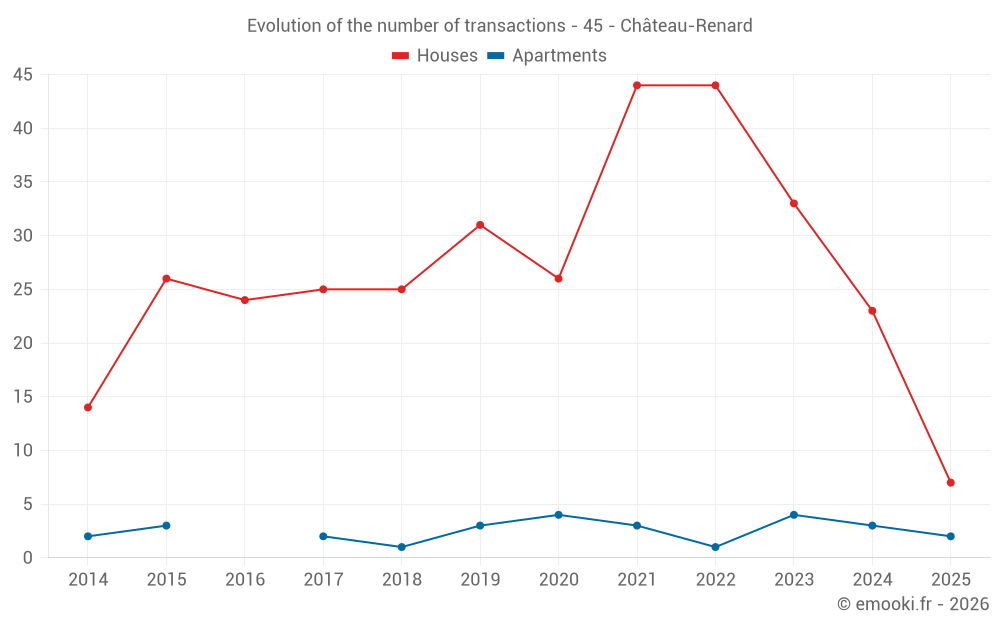
Median price on the 21 transactions of the last 12 months.
from 767 to
1 937  /m²
60% of transactions from the 2nd to the 8th deciles.
ApartmentsApartments
684  /m²
1-23-45-67-89-10
Reliability 5/10
Median price on the 12 transactions of the last 48 months.
from 403 to
972  /m²
60% of transactions from the 2nd to the 8th deciles.
DwellingsDwellings
1 094  /m²
1-23-45-67-89-10
Reliability 8/10
Median price on the 24 transactions of the last 12 months.
from 742 to
1 747  /m²
60% of transactions from the 2nd to the 8th deciles.
HousesEvolution of the price per m² of houses since...
1 year
-20%
2 years
-39%
3 years
-7.6%
4 years
+0.2%
5 years
+2.3%
6 years
+4.1%
7 years
-5.6%
8 years
-8.2%
9 years
-5.4%
10 years
-6.5%
11 years
+5.6%
ApartmentsEvolution of the price per m² of apartments since...
1 year
--
2 years
--
3 years
--
4 years
--
5 years
--
6 years
--
7 years
--
8 years
--
9 years
--
10 years
--
11 years
--

Yearly evolution

Evolution of the median price per m²

Evolution of the number of transactions

Warning, last year incomplete. Projections made based on the proportions between semesters of the previous year at the departmental/national level and by type of property.

Yearly data

Descending order
Year
Houses
house
transactions
Houses
house
Price per m²
Apartments
apt.
transactions
Apartments
apt.
Price per m²
2025
7
1 088 
2
757 
2024
23
1 356 
3
486 
2023
33
1 791 
4
815 
2022
44
1 178 
1
278 
2021
44
1 086 
3
711 
2020
26
1 064 
4
573 
2019
31
1 045 
3
612 
2018
25
1 153 
1
346 
2017
25
1 185 
2
604 
2016
24
1 150 
0
--- 
2015
26
1 164 
3
550 
2014
14
1 030 
2
254 

Analysis

Structure of prices per m²

Values of price percentiles per m² over the periods used for the estimated price of each type of property.

Structure of transaction amounts

Values of transaction amounts percentiles over the periods used for the estimated price of each type of property.

Transaction amounts and prices per m² by percentile

Ascending order
Percentile
Houses
house
Price per m²
Houses
house
Transaction amount
Apartments
apt.
Price per m²
Apartments
apt.
Transaction amount
10th percentile
702 
62 000 
377 
35 500 
20th percentile
767 
82 000 
403 
41 800 
30th percentile
891 
94 000 
436 
51 700 
40th percentile
1 088 
100 K
559 
64 200 
50th percentile
1 186 
109 K
684 
78 500 
60th percentile
1 473 
134 K
787 
89 200 
70th percentile
1 619 
138 K
904 
110 K
80th percentile
1 937 
143 K
972 
151 K
90th percentile
2 000 
190 K
1 043 
208 K

National and departmental comparison

Evolution of the median price per m² of houses

Evolution of the median price per m² of apartments

Quarterly evolution

Evolution of the median price per m²

Evolution of the number of transactions

Quarterly data

Descending order
Quarter
Houses
house
transactions
Houses
house
Price per m²
Apartments
apt.
transactions
Apartments
apt.
Price per m²
2025 Q2
3
1 473 
0
--- 
2025 Q1
4
928 
2
757 
2024 Q4
7
1 621 
0
--- 
2024 Q3
7
1 031 
1
1 050 
2024 Q2
7
786 
1
374 
2024 Q1
2
1 802 
1
486 
2023 Q4
7
1 351 
0
--- 
2023 Q3
11
1 411 
2
550 
2023 Q2
8
1 856 
1
1 281 
2023 Q1
7
1 746 
1
930 
2022 Q4
9
1 014 
1
278 
2022 Q3
9
1 478 
0
--- 
2022 Q2
9
1 393 
0
--- 
2022 Q1
17
1 176 
0
--- 
2021 Q4
11
1 045 
2
698 
2021 Q3
14
1 176 
0
--- 
2021 Q2
9
1 135 
1
711 
2021 Q1
10
954 
0
--- 
2020 Q4
6
1 000 
2
382 
2020 Q3
4
1 229 
2
573 
2020 Q2
6
1 212 
0
--- 
2020 Q1
10
922 
0
--- 
2019 Q4
8
1 200 
1
612 
2019 Q3
7
1 271 
2
646 
2019 Q2
10
1 151 
0
--- 
2019 Q1
6
416 
0
--- 
2018 Q4
5
632 
0
--- 
2018 Q3
6
1 596 
0
--- 
2018 Q2
7
1 113 
1
346 
2018 Q1
7
1 153 
0
--- 
2017 Q4
5
1 019 
0
--- 
2017 Q3
7
1 462 
0
--- 
2017 Q2
4
983 
0
--- 
2017 Q1
9
1 250 
2
604 
2016 Q4
7
894 
0
--- 
2016 Q3
7
1 231 
0
--- 
2016 Q2
7
938 
0
--- 
2016 Q1
3
1 662 
0
--- 
2015 Q4
12
1 146 
1
833 
2015 Q3
5
902 
0
--- 
2015 Q2
3
1 304 
1
550 
2015 Q1
6
1 198 
1
256 
2014 Q4
2
1 004 
0
--- 
2014 Q3
4
1 048 
0
--- 
2014 Q2
3
763 
2
254 
2014 Q1
5
1 111 
0
--- 

Loiret (45)

Most expensive cities

City
name
Descending orderHouses
house
Price per m²
3 031 
2 608 
2 604 
2 397 
City
name
Descending orderApartments
apt.
Price per m²
3 050 
2 904 
2 606 
2 497 
2 436 
2 408 

Least expensive cities

City
name
Ascending orderHouses
house
Price per m²
713 
768 
927 
City
name
Ascending orderApartments
apt.
Price per m²
274 
349 
385 
483 
495 
538