emooki
HomePrice mapTransactions
🇬🇧 English🇫🇷 Français🇩🇪 Deutsch🇪🇸 Español🇮🇹 Italiano

Real estate price map


Real estate price map in the municipality of La Chapelle-Saint-Mesmin, choose a section to see transactions by parcel.

Loiret (45)

La Chapelle-Saint-Mesmin - Real estate price m²

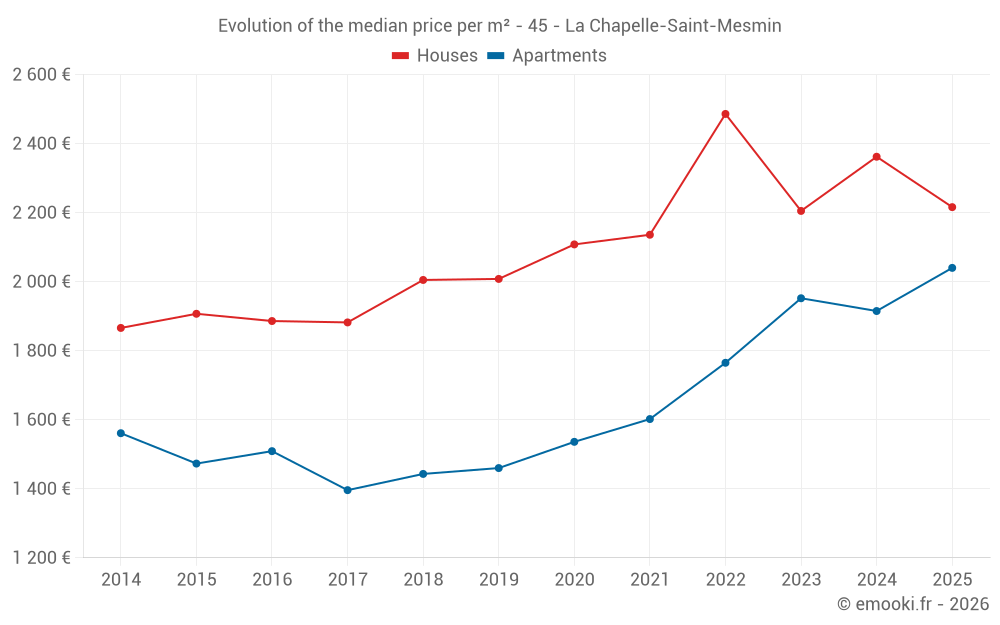
Median price of real estate
in the municipality of La Chapelle-Saint-Mesmin

HousesHouses
2 216  /m²
1-23-45-67-89-10
Reliability 9/10
Median price on the 33 transactions of the last 6 months.
from 1 773 to
2 994  /m²
60% of transactions from the 2nd to the 8th deciles.
ApartmentsApartments
2 040  /m²
1-23-45-67-89-10
Reliability 9/10
Median price on the 18 transactions of the last 6 months.
from 1 325 to
3 012  /m²
60% of transactions from the 2nd to the 8th deciles.
DwellingsDwellings
2 179  /m²
1-23-45-67-89-10
Reliability 9/10
Median price on the 51 transactions of the last 6 months.
from 1 702 to
3 000  /m²
60% of transactions from the 2nd to the 8th deciles.
HousesEvolution of the price per m² of houses since...
1 year
-6.2%
2 years
+0.5%
3 years
-11%
4 years
+3.7%
5 years
+5.1%
6 years
+10%
7 years
+11%
8 years
+18%
9 years
+17%
10 years
+16%
11 years
+19%
The price per m² of houses has decreased by 11% since 3 years, but it has increased by 19% in 11 years.
ApartmentsEvolution of the price per m² of apartments since...
1 year
+6.5%
2 years
+4.5%
3 years
+16%
4 years
+27%
5 years
+33%
6 years
+40%
7 years
+41%
8 years
+46%
9 years
+35%
10 years
+38%
11 years
+31%

Yearly evolution

Evolution of the median price per m²

Evolution of the median price per m² - 45 - La Chapelle-Saint-Mesmin

Evolution of the number of transactions

Warning, last year incomplete. Projections made based on the proportions between semesters of the previous year at the departmental/national level and by type of property.

Evolution of the number of transactions - 45 - La Chapelle-Saint-Mesmin

Yearly data

Descending order
Year
Houses
house
transactions
Houses
house
Price per m²
Apartments
apt.
transactions
Apartments
apt.
Price per m²
2025
33
2 216 
18
2 040 
2024
74
2 362 
41
1 915 
2023
99
2 205 
43
1 952 
2022
100
2 486 
63
1 765 
2021
119
2 136 
59
1 602 
2020
104
2 108 
40
1 536 
2019
90
2 008 
47
1 460 
2018
69
2 005 
37
1 443 
2017
93
1 882 
40
1 396 
2016
82
1 886 
37
1 509 
2015
74
1 907 
33
1 473 
2014
61
1 866 
40
1 561 

Analysis

Structure of prices per m²

Values of price percentiles per m² over the periods used for the estimated price of each type of property.

Structure of transaction amounts

Values of transaction amounts percentiles over the periods used for the estimated price of each type of property.

Transaction amounts and prices per m² by percentile

Ascending order
Percentile
Houses
house
Price per m²
Houses
house
Transaction amount
Apartments
apt.
Price per m²
Apartments
apt.
Transaction amount
10th percentile
1 616 
162 K
932 
55 350 
20th percentile
1 773 
183 K
1 325 
70 000 
30th percentile
1 929 
185 K
1 714 
84 000 
40th percentile
1 974 
193 K
1 865 
103 K
50th percentile
2 216 
200 K
2 040 
126 K
60th percentile
2 445 
221 K
2 244 
139 K
70th percentile
2 723 
244 K
2 702 
141 K
80th percentile
2 994 
287 K
3 012 
146 K
90th percentile
3 323 
372 K
3 114 
161 K

National and departmental comparison

Evolution of the median price per m² of houses

Evolution of the median price per m² of apartments

Quarterly evolution

Evolution of the median price per m²

Evolution of the number of transactions

Quarterly data

Descending order
Quarter
Houses
house
transactions
Houses
house
Price per m²
Apartments
apt.
transactions
Apartments
apt.
Price per m²
2025 Q2
6
2 038 
4
2 538 
2025 Q1
27
2 361 
14
1 883 
2024 Q4
17
2 625 
8
1 958 
2024 Q3
19
2 392 
11
2 000 
2024 Q2
15
2 308 
12
1 831 
2024 Q1
23
2 347 
10
2 108 
2023 Q4
18
2 184 
9
1 841 
2023 Q3
37
2 255 
12
1 793 
2023 Q2
22
2 290 
13
1 954 
2023 Q1
22
2 056 
9
2 034 
2022 Q4
21
2 328 
15
1 806 
2022 Q3
34
2 660 
23
1 696 
2022 Q2
23
2 361 
15
1 765 
2022 Q1
22
2 474 
10
1 858 
2021 Q4
28
2 320 
10
1 861 
2021 Q3
40
1 953 
21
1 738 
2021 Q2
39
2 132 
13
1 593 
2021 Q1
12
1 813 
15
1 508 
2020 Q4
30
2 214 
10
1 605 
2020 Q3
30
2 078 
6
1 606 
2020 Q2
24
2 078 
4
1 522 
2020 Q1
20
1 908 
20
1 486 
2019 Q4
19
2 011 
13
1 358 
2019 Q3
29
2 032 
14
1 448 
2019 Q2
23
1 642 
12
1 444 
2019 Q1
19
2 142 
8
1 606 
2018 Q4
12
2 020 
4
2 022 
2018 Q3
23
2 116 
14
1 323 
2018 Q2
14
1 883 
12
1 375 
2018 Q1
20
2 088 
7
1 864 
2017 Q4
23
1 833 
9
1 148 
2017 Q3
30
1 994 
9
1 417 
2017 Q2
20
1 925 
11
1 424 
2017 Q1
20
1 866 
11
1 475 
2016 Q4
17
2 000 
9
1 622 
2016 Q3
23
1 725 
13
1 784 
2016 Q2
21
1 786 
10
1 464 
2016 Q1
21
2 154 
5
1 349 
2015 Q4
16
1 964 
8
1 460 
2015 Q3
28
1 924 
9
1 480 
2015 Q2
13
1 878 
10
1 587 
2015 Q1
17
1 686 
6
1 458 
2014 Q4
15
2 111 
4
1 220 
2014 Q3
18
1 896 
10
1 754 
2014 Q2
10
1 823 
11
1 571 
2014 Q1
18
1 702 
15
1 551 

Overview of the latest real estate transactions

The following list is an anonymized overview of the latest transactions. For more details and to find all transactions, please use the map to view transactions by plot or the transaction search page for a search by criteria.

2025-06-04
140 700 
3 127  /m²(45 m²)
Sale
Apartments
Apartment
2 rooms
45 m2
1 outbuilding
2025-06-02
196 000 
2 450  /m²(80 m²)
Sale
Houses
House
4 rooms
80 m2
Land
267 m2
-Sols
2025-05-28
189 220 
1 752  /m²(108 m²)
Sale
Houses
House
6 rooms
108 m2
2025-05-27
139 000 
2 896  /m²(48 m²)
Sale
Apartments
Apartment
2 rooms
48 m2
1 outbuilding
2025-05-23
185 000 
2 102  /m²(88 m²)
Sale
Houses
House
3 rooms
88 m2
1 outbuilding
Land
249 m2
-Sols
2025-05-21
160 000 
1 975  /m²(81 m²)
Sale
Houses
House
4 rooms
81 m2
1 outbuilding
Land
442 m2
-Sols
Land
264 m2
-Sols
2025-05-20
58 000 
Sale
Land
57 m2
-Sols
Land
13 m2
-Sols
Land
235 m2
-Sols
2025-05-16
4 500 
Sale
1 outbuilding
2025-05-16
149 000 
1 863  /m²(80 m²)
Sale
Apartments
Apartment
4 rooms
80 m2
3 outbuildings
2025-05-15
450 000 
3 000  /m²(150 m²)
Sale
Houses
House
6 rooms
150 m2
Land
990 m2
-Sols
Land
20 m2
-Sols
2025-05-14
133 000 
transaction.nature.Vente terrain à bâtir
Land
679 m2
-Terrains à bâtir
2025-05-14
5 520 000 
Sale
2025-04-28
107 000 
Sale
Land
508 m2
-Terrains à bâtir
Land
239 m2
-Sols
2025-04-24
115 500 
2 179  /m²(53 m²)
Sale
Apartments
Apartment
3 rooms
53 m2
1 outbuilding
2025-04-10
190 900 
1 928  /m²(99 m²)
Sale
Houses
House
5 rooms
99 m2
Land
288 m2
-Sols
2025-03-31
314 000 
2 492  /m²(126 m²)
Sale
Houses
House
5 rooms
126 m2
1 outbuilding
Land
652 m2
-Sols
2025-03-29
93 000 
1 368  /m²(68 m²)
Sale
Apartments
Apartment
3 rooms
68 m2
1 outbuilding
2025-03-28
380 000 
3 619  /m²(105 m²)
Sale
Houses
House
5 rooms
105 m2
1 outbuilding
Land
251 m2
-Sols
2025-03-28
485 850 
4 049  /m²(120 m²)
Sale
Houses
House
6 rooms
120 m2
2 outbuildings
Land
800 m2
-Sols
Land
632 m2
-Jardins
/Jardin potager
2025-03-28
184 000 
1 804  /m²(102 m²)
Sale
Land
7 m2
-Sols
Houses
House
5 rooms
102 m2
1 outbuilding
Land
771 m2
-Sols
2443 transactions listed in the municipality

Loiret (45)

Most expensive cities

City
name
Descending orderHouses
house
Price per m²
3 031 
2 608 
2 604 
2 397 
City
name
Descending orderApartments
apt.
Price per m²
3 050 
2 904 
2 606 
2 497 
2 436 
2 408 

Least expensive cities

City
name
Ascending orderHouses
house
Price per m²
713 
768 
927 
City
name
Ascending orderApartments
apt.
Price per m²
274 
349 
385 
483 
495 
538