emooki
HomePrice mapTransactions
🇬🇧 English🇫🇷 Français🇩🇪 Deutsch🇪🇸 Español🇮🇹 Italiano

Real estate price map


Real estate price map in the municipality of Villerest, choose a section to see transactions by parcel.

Loire (42)

Villerest - Real estate price m²

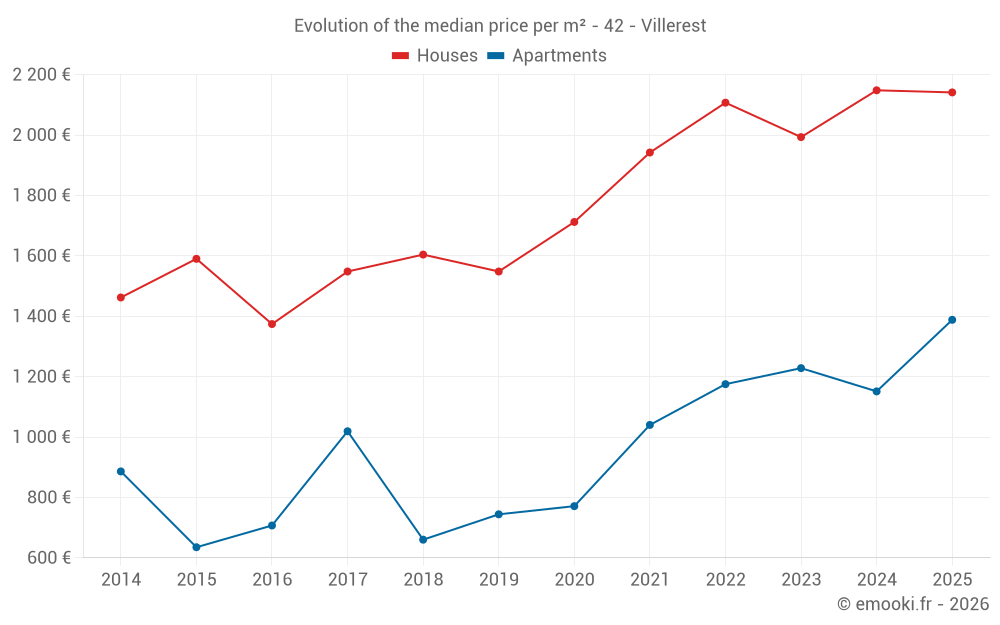
Median price of real estate
in the municipality of Villerest

HousesHouses
2 141  /m²
1-23-45-67-89-10
Reliability 9/10
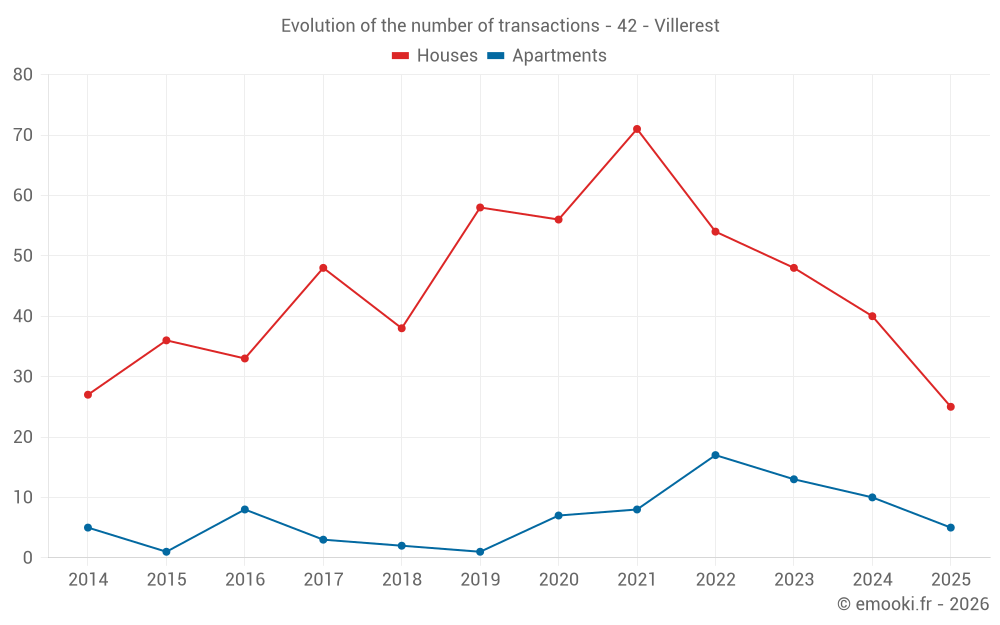
Median price on the 25 transactions of the last 6 months.
from 975 to
2 434  /m²
60% of transactions from the 2nd to the 8th deciles.
ApartmentsApartments
1 268  /m²
1-23-45-67-89-10
Reliability 7/10
Median price on the 23 transactions of the last 24 months.
from 1 093 to
1 387  /m²
60% of transactions from the 2nd to the 8th deciles.
DwellingsDwellings
1 965  /m²
1-23-45-67-89-10
Reliability 9/10
Median price on the 30 transactions of the last 6 months.
from 988 to
2 418  /m²
60% of transactions from the 2nd to the 8th deciles.
HousesEvolution of the price per m² of houses since...
1 year
-0.3%
2 years
+7.4%
3 years
+1.6%
4 years
+10%
5 years
+25%
6 years
+38%
7 years
+33%
8 years
+38%
9 years
+56%
10 years
+35%
11 years
+46%
The price per m² of houses has decreased by 0.3% since 1 year, but it has increased by 56% in 9 years.
ApartmentsEvolution of the price per m² of apartments since...
1 year
+21%
2 years
+13%
3 years
+18%
4 years
+33%
5 years
+80%
6 years
--
7 years
--
8 years
--
9 years
+96%
10 years
--
11 years
+57%

Yearly evolution

Evolution of the median price per m²

Evolution of the median price per m² - 42 - Villerest

Evolution of the number of transactions

Warning, last year incomplete. Projections made based on the proportions between semesters of the previous year at the departmental/national level and by type of property.

Evolution of the number of transactions - 42 - Villerest

Yearly data

Descending order
Year
Houses
house
transactions
Houses
house
Price per m²
Apartments
apt.
transactions
Apartments
apt.
Price per m²
2025
25
2 141 
5
1 388 
2024
40
2 148 
10
1 151 
2023
48
1 993 
13
1 228 
2022
54
2 107 
17
1 175 
2021
71
1 942 
8
1 040 
2020
56
1 712 
7
771 
2019
58
1 548 
1
744 
2018
38
1 604 
2
660 
2017
48
1 548 
3
1 019 
2016
33
1 374 
8
707 
2015
36
1 590 
1
635 
2014
27
1 462 
5
886 

Analysis

Structure of prices per m²

Values of price percentiles per m² over the periods used for the estimated price of each type of property.

Structure of transaction amounts

Values of transaction amounts percentiles over the periods used for the estimated price of each type of property.

Transaction amounts and prices per m² by percentile

Ascending order
Percentile
Houses
house
Price per m²
Houses
house
Transaction amount
Apartments
apt.
Price per m²
Apartments
apt.
Transaction amount
10th percentile
632 
84 000 
950 
44 200 
20th percentile
975 
131 K
1 093 
50 280 
30th percentile
1 581 
167 K
1 190 
51 230 
40th percentile
1 983 
190 K
1 213 
52 200 
50th percentile
2 141 
212 K
1 268 
54 000 
60th percentile
2 238 
237 K
1 304 
57 520 
70th percentile
2 387 
261 K
1 340 
68 460 
80th percentile
2 434 
283 K
1 387 
70 000 
90th percentile
2 862 
420 K
1 479 
79 360 

National and departmental comparison

Evolution of the median price per m² of houses

Evolution of the median price per m² of apartments

Quarterly evolution

Evolution of the median price per m²

Evolution of the number of transactions

Quarterly data

Descending order
Quarter
Houses
house
transactions
Houses
house
Price per m²
Apartments
apt.
transactions
Apartments
apt.
Price per m²
2025 Q2
14
2 240 
1
939 
2025 Q1
11
2 055 
4
1 392 
2024 Q4
11
2 289 
1
994 
2024 Q3
18
1 928 
5
1 300 
2024 Q2
4
2 206 
3
1 120 
2024 Q1
7
2 056 
1
1 385 
2023 Q4
8
2 021 
5
1 215 
2023 Q3
14
1 927 
3
1 268 
2023 Q2
11
1 972 
2
1 200 
2023 Q1
15
2 075 
3
1 450 
2022 Q4
12
1 968 
6
1 338 
2022 Q3
12
2 126 
3
1 481 
2022 Q2
12
2 164 
5
1 128 
2022 Q1
18
2 204 
3
1 033 
2021 Q4
13
2 000 
2
1 477 
2021 Q3
27
1 988 
3
1 037 
2021 Q2
15
1 554 
2
928 
2021 Q1
16
1 913 
1
779 
2020 Q4
18
1 505 
3
986 
2020 Q3
19
1 798 
0
--- 
2020 Q2
12
1 797 
2
742 
2020 Q1
7
1 657 
2
1 140 
2019 Q4
8
1 564 
0
--- 
2019 Q3
16
1 581 
1
744 
2019 Q2
20
1 436 
0
--- 
2019 Q1
14
1 599 
0
--- 
2018 Q4
9
1 699 
0
--- 
2018 Q3
14
1 519 
2
660 
2018 Q2
6
1 654 
0
--- 
2018 Q1
9
1 500 
0
--- 
2017 Q4
11
1 550 
1
1 486 
2017 Q3
12
1 792 
0
--- 
2017 Q2
15
1 528 
1
1 019 
2017 Q1
10
1 584 
1
526 
2016 Q4
4
1 560 
2
1 000 
2016 Q3
14
1 220 
1
671 
2016 Q2
6
1 385 
1
743 
2016 Q1
9
1 342 
4
722 
2015 Q4
10
1 577 
0
--- 
2015 Q3
11
1 531 
0
--- 
2015 Q2
10
1 699 
0
--- 
2015 Q1
5
1 476 
1
635 
2014 Q4
9
1 462 
3
886 
2014 Q3
4
1 321 
1
1 052 
2014 Q2
10
1 531 
0
--- 
2014 Q1
4
1 504 
1
565 

Overview of the latest real estate transactions

The following list is an anonymized overview of the latest transactions. For more details and to find all transactions, please use the map to view transactions by plot or the transaction search page for a search by criteria.

2025-06-27
55 400 
Sale
Land
407 m2
-Terrains à bâtir
Land
416 m2
-Terrains à bâtir
Land
416 m2
-Terrains à bâtir
2025-06-18
253 000 
2 279  /m²(111 m²)
Sale
Houses
House
5 rooms
111 m2
Land
727 m2
-Sols
2025-06-13
53 500 
939  /m²(57 m²)
Sale
Apartments
Apartment
3 rooms
57 m2
1 outbuilding
2025-06-12
263 000 
1 538  /m²(171 m²)
Sale
Houses
House
7 rooms
171 m2
2 outbuildings
Land
647 m2
-Sols
2025-05-21
475 700 
2 202  /m²(216 m²)
Sale
Houses
House
9 rooms
216 m2
2 outbuildings
Land
875 m2
-Sols
Land
1249 m2
-Terrains d'agrément
2025-05-19
335 890 
2 416  /m²(139 m²)
Sale
Houses
House
4 rooms
139 m2
Land
1000 m2
-Sols
Land
620 m2
-Terrains d'agrément
Land
461 m2
-Sols
2025-05-16
616 700 
3 334  /m²(185 m²)
Sale
Land
1768 m2
-Sols
Houses
House
5 rooms
185 m2
2 outbuildings
Land
500 m2
-Sols
Land
1420 m2
-Terrains d'agrément
Land
61 m2
-Sols
Land
61 m2
-Sols
Land
399 m2
-Sols
Land
196 m2
-Sols
Land
1026 m2
-Sols
2025-05-16
253 850 
2 672  /m²(95 m²)
Sale
Houses
House
5 rooms
95 m2
Land
1500 m2
-Prés
Land
340 m2
-Prés
Land
2 m2
-Prés
2025-05-12
137 010 
1 384  /m²(99 m²)
Sale
Houses
House
6 rooms
99 m2
Land
821 m2
-Sols
2025-04-30
215 000 
2 389  /m²(90 m²)
Sale
Houses
House
4 rooms
90 m2
Land
790 m2
-Sols
Land
397 m2
-Sols
2025-04-25
278 000 
2 989  /m²(93 m²)
Sale
Houses
House
5 rooms
93 m2
1 outbuilding
Land
531 m2
-Sols
Land
559 m2
-Sols
2025-04-16
150 000 
489  /m²(307 m²)
Sale
Houses
House
4 rooms
90 m2
Houses
House
9 rooms
217 m2
2025-04-16
62 500 
446  /m²(140 m²)
Sale
Houses
House
5 rooms
140 m2
Land
216 m2
-Sols
Land
54 m2
-Sols
2025-04-15
212 000 
2 141  /m²(99 m²)
Sale
Houses
House
4 rooms
99 m2
Land
768 m2
-Sols
Land
390 m2
-Sols
Land
133 m2
-Sols
2025-04-14
505 000 
3 459  /m²(146 m²)
Sale
Houses
House
4 rooms
146 m2
1 outbuilding
Land
730 m2
-Sols
Land
1393 m2
-Terrains d'agrément
Land
94 m2
-Sols
2025-04-03
62 000 
674  /m²(92 m²)
Sale
Houses
House
4 rooms
92 m2
Land
65 m2
-Sols
2025-03-31
80 000 
Sale
Land
770 m2
-Prés
2025-03-31
176 730 
2 055  /m²(86 m²)
Sale
Houses
House
4 rooms
86 m2
Land
815 m2
-Sols
Land
970 m2
-Terrains à bâtir
Land
264 m2
-Sols
2025-03-26
197 300 
2 466  /m²(80 m²)
Sale
Houses
House
4 rooms
80 m2
Land
297 m2
-Sols
Land
1389 m2
-Jardins
/Jardin potager
2025-03-25
205 000 
1 752  /m²(117 m²)
Sale
Houses
House
6 rooms
117 m2
Land
973 m2
-Sols
981 transactions listed in the municipality

Loire (42)

Most expensive cities

City
name
Descending orderHouses
house
Price per m²
3 194 
3 023 
2 973 
2 928 
2 927 
2 924 
2 905 
City
name
Descending orderApartments
apt.
Price per m²
3 361 
2 413 
2 363 
2 359 
2 220 

Least expensive cities

City
name
Ascending orderHouses
house
Price per m²
737 
755 
772 
774 
City
name
Ascending orderApartments
apt.
Price per m²
178 
255 
287 
304