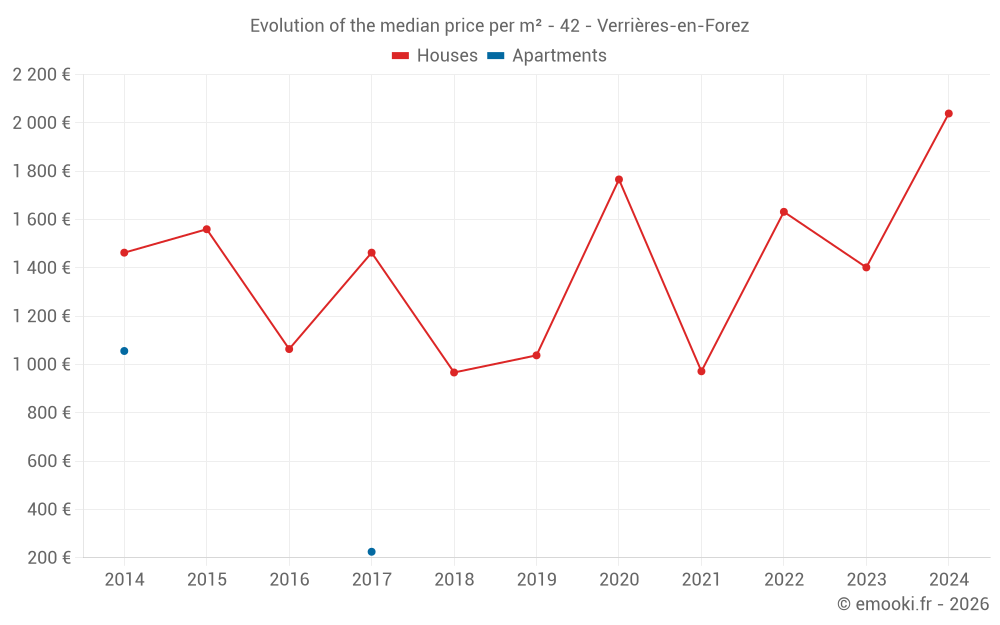
Median price of real estate
in the municipality of Verrières-en-Forez
Houses
1 578 € /m²
Reliability 6/10
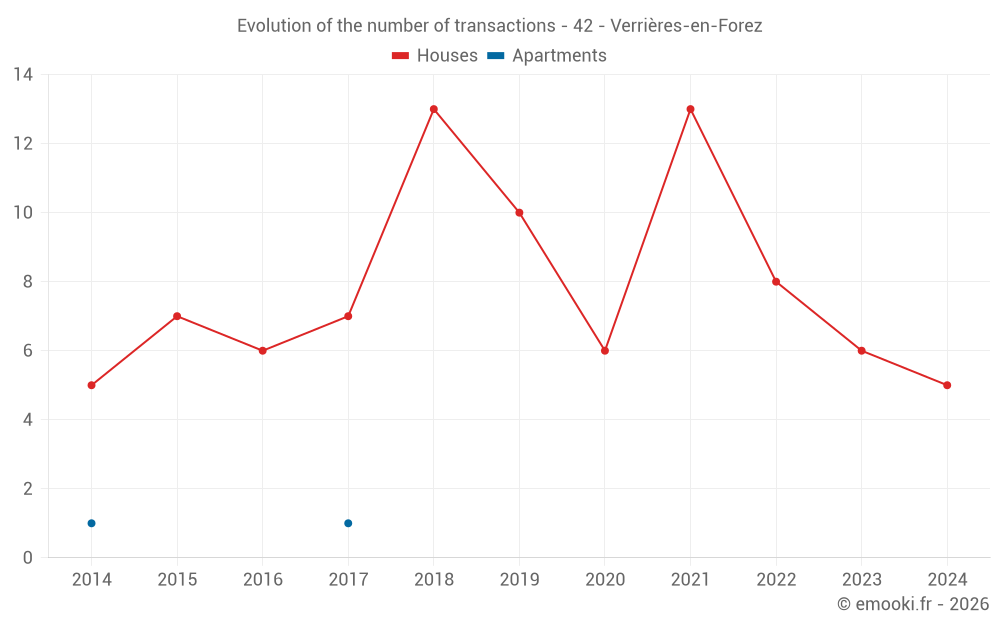
Median price on the 16 transactions of the last 36 months.
from 1 333 to
2 151 € /m²
2 151 € /m²
60% of transactions from the 2nd to the 8th deciles.
Apartments
225 € /m²
Reliability 1/10
Price of the unique transaction of the last 120 months.
Dwellings
1 578 € /m²
Reliability 6/10
Median price on the 16 transactions of the last 36 months.
from 1 333 to
2 151 € /m²
2 151 € /m²
60% of transactions from the 2nd to the 8th deciles.