emooki
HomePrice mapTransactions
🇬🇧 English🇫🇷 Français🇩🇪 Deutsch🇪🇸 Español🇮🇹 Italiano

Real estate price map


Real estate price map in the municipality of Saint-Just-en-Chevalet, choose a section to see transactions by parcel.

Loire (42)
Saint-Just-en-Chevalet

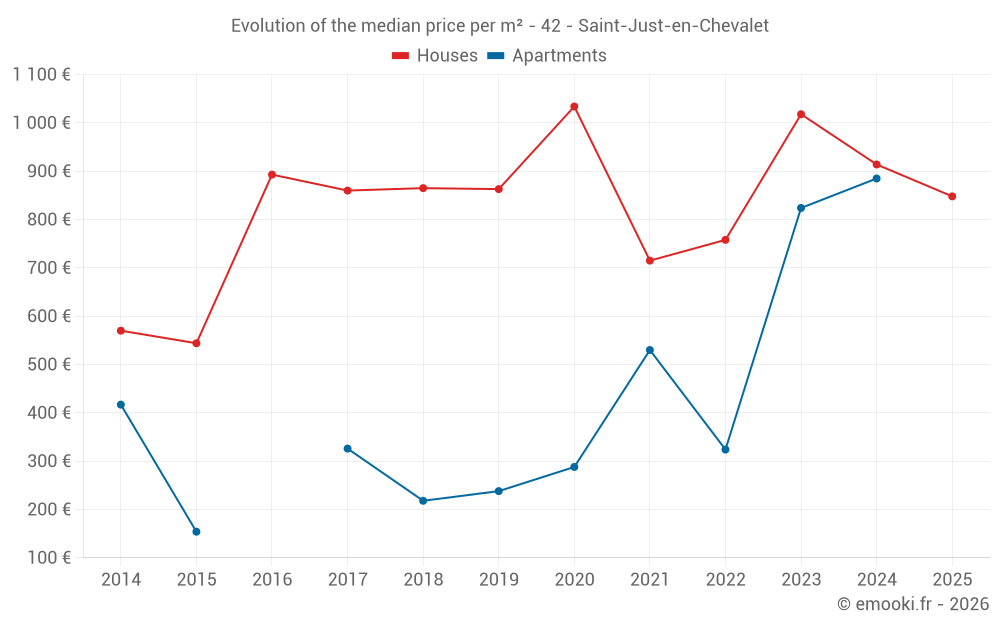
Median price of real estate
in the municipality of Saint-Just-en-Chevalet

HousesHouses
920 € /m²
1-23-45-67-89-10
Reliability 7/10
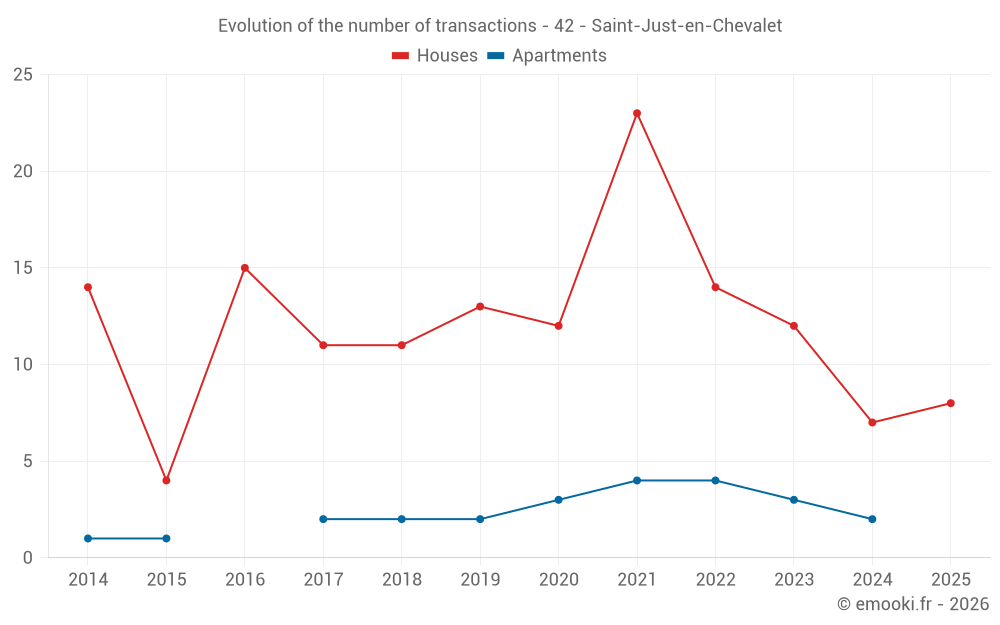
Median price on the 21 transactions of the last 24 months.
from 315 to
1 471 € /m²
60% of transactions from the 2nd to the 8th deciles.
ApartmentsApartments
645 € /m²
1-23-45-67-89-10
Reliability 5/10
Median price on the 11 transactions of the last 48 months.
from 242 to
1 025 € /m²
60% of transactions from the 2nd to the 8th deciles.
DwellingsDwellings
966 € /m²
1-23-45-67-89-10
Reliability 7/10
Median price on the 24 transactions of the last 24 months.
from 307 to
1 477 € /m²
60% of transactions from the 2nd to the 8th deciles.
HousesEvolution of the price per m² of houses since...
1 year
-7.2%
2 years
-17%
3 years
+12%
4 years
+19%
5 years
-18%
6 years
-1.7%
7 years
-2%
8 years
-1.4%
9 years
-5%
10 years
+56%
11 years
+49%
The price per m² of houses has decreased by 18% since 5 years, but it has increased by 56% in 10 years.

Yearly evolution

Evolution of the median price per m²

Evolution of the number of transactions

Warning, last year incomplete. Projections made based on the proportions between semesters of the previous year at the departmental/national level and by type of property.

Yearly data

Descending order
Year
Houses
house
transactions
Houses
house
Price per m²
Apartments
apt.
transactions
Apartments
apt.
Price per m²
2025
8
848 €
0
--- €
2024
7
914 €
2
885 €
2023
12
1 018 €
3
824 €
2022
14
758 €
4
324 €
2021
23
715 €
4
530 €
2020
12
1 034 €
3
288 €
2019
13
863 €
2
238 €
2018
11
865 €
2
218 €
2017
11
860 €
2
326 €
2016
15
893 €
0
--- €
2015
4
544 €
1
154 €
2014
14
570 €
1
417 €

Analysis

Structure of prices per m²

Values of price percentiles per m² over the periods used for the estimated price of each type of property.

Structure of transaction amounts

Values of transaction amounts percentiles over the periods used for the estimated price of each type of property.

Transaction amounts and prices per m² by percentile

Ascending order
Percentile
Houses
house
Price per m²
Houses
house
Transaction amount
Apartments
apt.
Price per m²
Apartments
apt.
Transaction amount
10th percentile
246 €
29 000 €
234 €
32 000 €
20th percentile
315 €
40 000 €
242 €
36 900 €
30th percentile
607 €
69 000 €
410 €
46 900 €
40th percentile
875 €
85 000 €
414 €
68 800 €
50th percentile
920 €
100 K€
645 €
80 000 €
60th percentile
1 017 €
107 K€
824 €
80 000 €
70th percentile
1 183 €
145 K€
869 €
120 K€
80th percentile
1 471 €
153 K€
1 025 €
124 K€
90th percentile
1 667 €
195 K€
1 323 €
202 K€

National and departmental comparison

Evolution of the median price per m² of houses

Evolution of the median price per m² of apartments

Quarterly evolution

Evolution of the median price per m²

Evolution of the number of transactions

Quarterly data

Descending order
Quarter
Houses
house
transactions
Houses
house
Price per m²
Apartments
apt.
transactions
Apartments
apt.
Price per m²
2025 Q2
3
1 012 €
0
--- €
2025 Q1
5
685 €
0
--- €
2024 Q4
3
914 €
0
--- €
2024 Q3
0
--- €
2
885 €
2024 Q2
3
1 471 €
0
--- €
2024 Q1
1
607 €
0
--- €
2023 Q4
4
1 223 €
0
--- €
2023 Q3
2
1 029 €
1
1 323 €
2023 Q2
3
455 €
0
--- €
2023 Q1
3
1 019 €
2
617 €
2022 Q4
2
492 €
1
1 025 €
2022 Q3
4
1 339 €
1
90 €
2022 Q2
3
1 563 €
1
414 €
2022 Q1
5
350 €
1
234 €
2021 Q4
5
556 €
1
869 €
2021 Q3
6
649 €
1
645 €
2021 Q2
6
944 €
0
--- €
2021 Q1
6
710 €
2
314 €
2020 Q4
3
1 372 €
2
200 €
2020 Q3
4
1 531 €
0
--- €
2020 Q2
2
379 €
0
--- €
2020 Q1
3
813 €
1
494 €
2019 Q4
2
868 €
0
--- €
2019 Q3
1
976 €
1
233 €
2019 Q2
5
975 €
1
242 €
2019 Q1
5
681 €
0
--- €
2018 Q4
3
865 €
0
--- €
2018 Q3
4
623 €
1
81 €
2018 Q2
3
340 €
1
355 €
2018 Q1
1
1 173 €
0
--- €
2017 Q4
2
1 130 €
0
--- €
2017 Q3
2
532 €
2
326 €
2017 Q2
2
1 014 €
0
--- €
2017 Q1
5
860 €
0
--- €
2016 Q4
2
1 184 €
0
--- €
2016 Q3
7
813 €
0
--- €
2016 Q2
3
983 €
0
--- €
2016 Q1
3
231 €
0
--- €
2015 Q4
1
606 €
0
--- €
2015 Q3
1
375 €
1
154 €
2015 Q2
1
483 €
0
--- €
2015 Q1
1
1 417 €
0
--- €
2014 Q3
5
902 €
0
--- €
2014 Q2
6
570 €
1
417 €
2014 Q1
3
351 €
0
--- €

Overview of the latest real estate transactions

The following list is an anonymized overview of the latest transactions. For more details and to find all transactions, please use the map to view transactions by plot or the transaction search page for a search by criteria.

2025-06-03
700 €
Sale
Land
4350 m2
-Futaies résineuses
/Pins
2025-05-05
145 000 €
1 160 € /m²(125 m²)
Sale
Houses
House
5 rooms
125 m2
Land
705 m2
-Sols
Land
600 m2
-Terrains d'agrément
Land
1036 m2
-Sols
2025-04-29
1 000 €
Sale
Land
100 m2
-Sols
2025-04-23
83 000 €
1 012 € /m²(82 m²)
Sale
Houses
House
5 rooms
82 m2
Land
1060 m2
-Sols
Land
188 m2
-Landes
Land
18 m2
-Sols
Land
361 m2
-Jardins
Land
140 m2
-Jardins
Land
6 m2
-Sols
2025-04-18
29 000 €
315 € /m²(92 m²)
Sale
Houses
House
4 rooms
92 m2
1 outbuilding
Land
95 m2
-Sols
Land
50 m2
-Jardins
Land
14 m2
-Sols
Land
12 m2
-Sols
Land
140 m2
-Jardins
Land
465 m2
-Jardins
2025-04-17
5 000 €
Sale
Land
233 m2
-Sols
2025-03-31
67 000 €
Sale
Land
755 m2
-Futaies résineuses
/Sapins ou sapinière
Land
755 m2
-Bois
Land
2610 m2
-Terres
Land
29440 m2
-Bois
Land
3175 m2
-Futaies résineuses
/Sapins ou sapinière
Land
3175 m2
-Bois
Land
1180 m2
-Pâtures
Land
7166 m2
-Futaies résineuses
/Sapins ou sapinière
Land
2914 m2
-Futaies résineuses
/Sapins ou sapinière
Land
10010 m2
-Futaies feuillues
Land
2840 m2
-Futaies feuillues
Land
5587 m2
-Pâtures
Land
1570 m2
-Futaies résineuses
/Sapins ou sapinière
Land
960 m2
-Futaies résineuses
/Sapins ou sapinière
Land
10420 m2
-Futaies feuillues
Land
10467 m2
-Futaies feuillues
2025-03-26
13 000 €
394 € /m²(33 m²)
Sale
Houses
House
1 room
33 m2
Land
220 m2
-Sols
Land
735 m2
-Jardins
2025-02-19
90 000 €
270 € /m²(333 m²)
309 € /m²(291 m²)
Sale
Apartments
Apartment
5 rooms
97 m2
Apartments
Apartment
5 rooms
97 m2
Apartments
Apartment
3 rooms
97 m2
Commercial property
42 m2
Land
230 m2
-Sols
2025-02-17
100 100 €
294 € /m²(340 m²)
Sale
Houses
House
9 rooms
140 m2
Houses
House
6 rooms
200 m2
Land
510 m2
-Sols
Land
328 m2
-Prés
Land
708 m2
-Prés
Land
1243 m2
-Jardins
2025-02-07
195 495 €
1 700 € /m²(115 m²)
Sale
Houses
House
4 rooms
115 m2
Land
420 m2
-Sols
2025-02-05
185 000 €
685 € /m²(270 m²)
Sale
Houses
House
6 rooms
270 m2
Land
942 m2
-Sols
Land
1500 m2
-Terrains d'agrément
2025-01-07
315 210 €
2 284 € /m²(138 m²)
Sale
Houses
House
6 rooms
138 m2
3 outbuildings
Land
2200 m2
-Sols
Land
5100 m2
-Prés
2024-12-18
40 000 €
140 € /m²(286 m²)
Sale
Houses
House
2 rooms
286 m2
Land
305 m2
-Sols
2024-12-17
300 €
Sale
Land
1530 m2
-Prés
Land
1110 m2
-Landes
2024-10-30
117 000 €
914 € /m²(128 m²)
Sale
Houses
House
6 rooms
128 m2
2 outbuildings
Land
1128 m2
-Sols
Land
673 m2
-Jardins
Land
7050 m2
-Pâtures
2024-10-02
69 000 €
920 € /m²(75 m²)
Sale
Houses
House
3 rooms
75 m2
1 outbuilding
Land
102 m2
-Sols
Land
416 m2
-Jardins
2024-09-24
1 200 €
Sale
Land
10430 m2
-Terres
2024-08-30
243 000 €
1 528 € /m²(159 m²)
Sale
Apartments
Apartment
5 rooms
104 m2
Apartments
Apartment
2 rooms
55 m2
5 outbuildings
Land
682 m2
-Sols
2024-08-02
350 €
Sale
Land
3552 m2
-Futaies résineuses
/Sapins ou sapinière
Land
413 m2
-Pâtures
Land
790 m2
-Futaies résineuses
/Sapins ou sapinière
401 transactions listed in the municipality

Loire (42)

Most expensive cities

City
name
Descending orderHouses
house
Price per m²
3 194 €
3 064 €
3 023 €
2 976 €
2 973 €
2 928 €
2 927 €
2 924 €
2 909 €
2 905 €
City
name
Descending orderApartments
apt.
Price per m²
3 361 €
2 914 €
2 413 €
2 374 €
2 363 €
2 359 €
2 340 €
2 273 €
2 265 €
2 220 €

Least expensive cities

City
name
Ascending orderHouses
house
Price per m²
692 €
737 €
755 €
772 €
774 €
City
name
Ascending orderApartments
apt.
Price per m²
178 €
225 €
255 €
260 €
263 €
287 €
304 €
306 €