emooki
HomePrice mapTransactions
🇬🇧 English🇫🇷 Français🇩🇪 Deutsch🇪🇸 Español🇮🇹 Italiano

Real estate price map


Real estate price map in the municipality of Régny, choose a section to see transactions by parcel.

Loire (42)
Régny

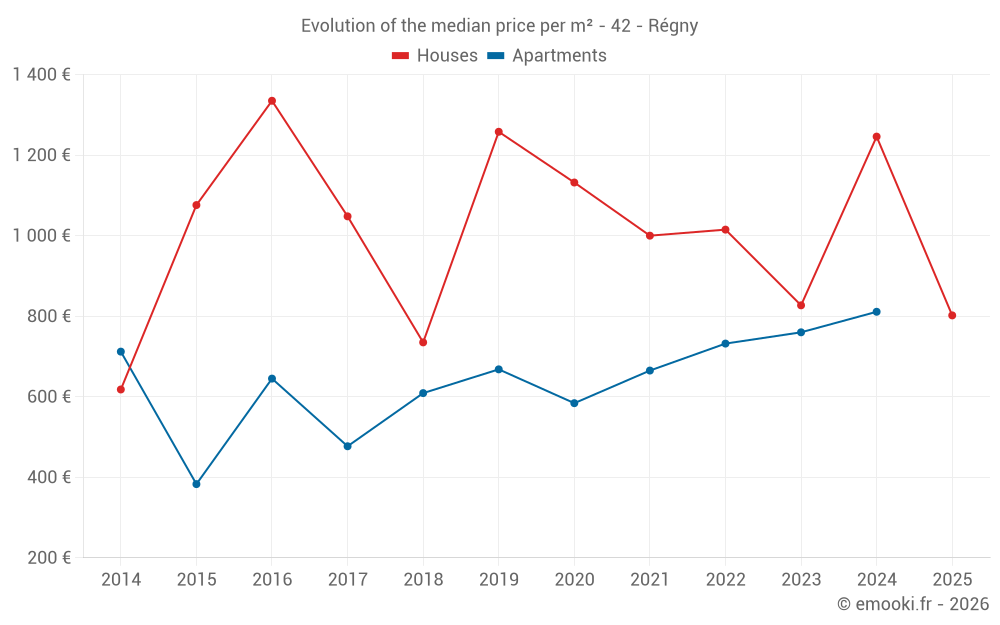
Median price of real estate
in the municipality of Régny

HousesHouses
1 221  /m²
1-23-45-67-89-10
Reliability 7/10
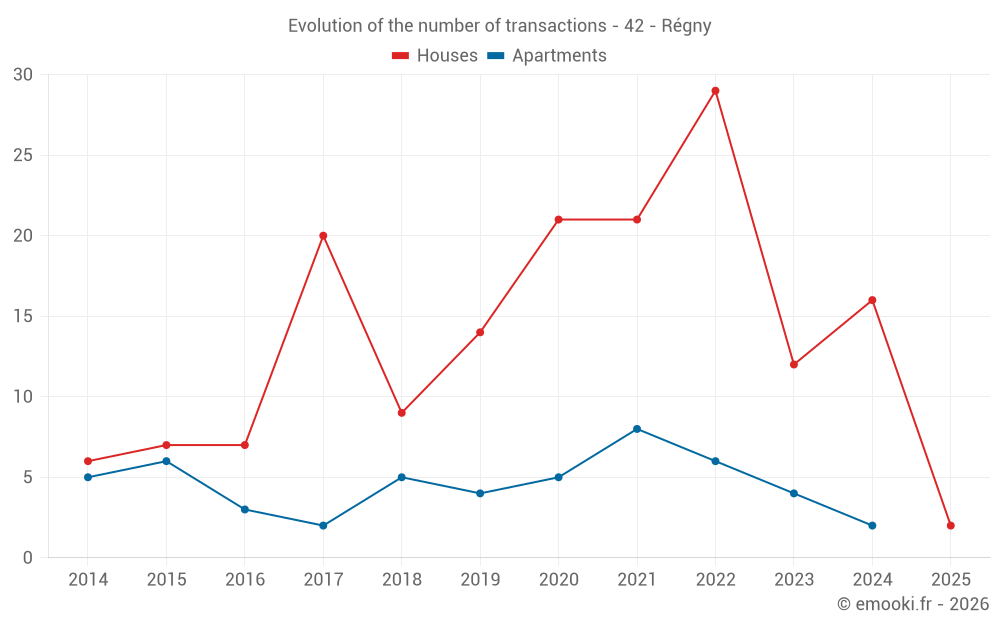
Median price on the 23 transactions of the last 24 months.
from 545 to
1 486  /m²
60% of transactions from the 2nd to the 8th deciles.
ApartmentsApartments
745  /m²
1-23-45-67-89-10
Reliability 5/10
Median price on the 17 transactions of the last 48 months.
from 660 to
894  /m²
60% of transactions from the 2nd to the 8th deciles.
DwellingsDwellings
1 194  /m²
1-23-45-67-89-10
Reliability 7/10
Median price on the 25 transactions of the last 24 months.
from 614 to
1 486  /m²
60% of transactions from the 2nd to the 8th deciles.

Yearly evolution

Evolution of the median price per m²

Evolution of the number of transactions

Warning, last year incomplete. Projections made based on the proportions between semesters of the previous year at the departmental/national level and by type of property.

Yearly data

Descending order
Year
Houses
house
transactions
Houses
house
Price per m²
Apartments
apt.
transactions
Apartments
apt.
Price per m²
2025
2
802 
0
--- 
2024
16
1 246 
2
811 
2023
12
827 
4
760 
2022
29
1 015 
6
732 
2021
21
1 000 
8
665 
2020
21
1 132 
5
584 
2019
14
1 258 
4
668 
2018
9
735 
5
609 
2017
20
1 048 
2
477 
2016
7
1 335 
3
645 
2015
7
1 076 
6
383 
2014
6
618 
5
712 

Analysis

Structure of prices per m²

Values of price percentiles per m² over the periods used for the estimated price of each type of property.

Structure of transaction amounts

Values of transaction amounts percentiles over the periods used for the estimated price of each type of property.

Transaction amounts and prices per m² by percentile

Ascending order
Percentile
Houses
house
Price per m²
Houses
house
Transaction amount
Apartments
apt.
Price per m²
Apartments
apt.
Transaction amount
10th percentile
427 
25 900 
527 
49 600 
20th percentile
545 
43 540 
660 
52 100 
30th percentile
814 
58 800 
706 
54 500 
40th percentile
1 012 
70 000 
730 
62 600 
50th percentile
1 221 
80 000 
745 
69 000 
60th percentile
1 367 
142 K
773 
93 280 
70th percentile
1 461 
159 K
791 
106 K
80th percentile
1 486 
178 K
894 
118 K
90th percentile
1 648 
213 K
944 
134 K

National and departmental comparison

Evolution of the median price per m² of houses

Evolution of the median price per m² of apartments

Quarterly evolution

Evolution of the median price per m²

Evolution of the number of transactions

Quarterly data

Descending order
Quarter
Houses
house
transactions
Houses
house
Price per m²
Apartments
apt.
transactions
Apartments
apt.
Price per m²
2025 Q2
2
802 
0
--- 
2024 Q4
3
1 029 
0
--- 
2024 Q3
5
1 467 
0
--- 
2024 Q2
5
1 194 
1
778 
2024 Q1
3
1 221 
1
844 
2023 Q4
3
946 
0
--- 
2023 Q3
2
963 
0
--- 
2023 Q2
3
729 
2
842 
2023 Q1
4
827 
2
414 
2022 Q4
6
628 
0
--- 
2022 Q3
9
1 160 
3
743 
2022 Q2
8
1 089 
2
882 
2022 Q1
6
1 448 
1
721 
2021 Q4
6
465 
2
721 
2021 Q3
7
1 000 
3
657 
2021 Q2
4
1 374 
2
674 
2021 Q1
4
1 813 
1
633 
2020 Q4
10
1 372 
1
129 
2020 Q3
4
1 586 
1
663 
2020 Q2
4
978 
1
1 190 
2020 Q1
3
617 
2
545 
2019 Q4
4
1 534 
1
756 
2019 Q3
3
1 587 
2
668 
2019 Q2
4
1 158 
0
--- 
2019 Q1
3
883 
1
579 
2018 Q4
2
686 
2
684 
2018 Q3
2
720 
2
412 
2018 Q2
3
1 239 
0
--- 
2018 Q1
2
1 154 
1
1 227 
2017 Q4
7
1 032 
0
--- 
2017 Q3
5
1 182 
2
477 
2017 Q2
6
667 
0
--- 
2017 Q1
2
1 020 
0
--- 
2016 Q4
1
1 439 
1
1 182 
2016 Q3
1
1 429 
0
--- 
2016 Q2
2
1 280 
2
569 
2016 Q1
3
1 296 
0
--- 
2015 Q4
2
974 
2
764 
2015 Q3
1
1 311 
1
343 
2015 Q2
1
311 
2
420 
2015 Q1
3
1 246 
1
130 
2014 Q3
1
1 544 
3
712 
2014 Q2
1
767 
2
736 
2014 Q1
4
440 
0
--- 

Overview of the latest real estate transactions

The following list is an anonymized overview of the latest transactions. For more details and to find all transactions, please use the map to view transactions by plot or the transaction search page for a search by criteria.

2025-06-27
219 000 
1 413  /m²(155 m²)
Sale
Houses
House
7 rooms
155 m2
Land
500 m2
-Sols
Land
1100 m2
-Terrains d'agrément
Land
46 m2
-Jardins
/Jardin potager
2025-06-17
45 113 
78  /m²(581 m²)
166  /m²(271 m²)
Sale
Houses
House
6 rooms
96 m2
Land
167 m2
-Sols
Apartments
Apartment
1 room
35 m2
Apartments
Apartment
3 rooms
65 m2
Apartments
Apartment
3 rooms
75 m2
1 outbuilding
Land
139 m2
-Sols
Commercial property
310 m2
Land
81 m2
-Sols
Land
60 m2
-Sols
2025-05-26
11 800 
190  /m²(62 m²)
Sale
Houses
House
3 rooms
62 m2
Land
30 m2
-Sols
2025-04-30
25 000 
83  /m²(303 m²)
129  /m²(194 m²)
Sale
Houses
House
3 rooms
54 m2
Commercial property
85 m2
Land
68 m2
-Sols
Apartments
Apartment
1 room
25 m2
Apartments
Apartment
5 rooms
65 m2
Apartments
Apartment
2 rooms
50 m2
Commercial property
24 m2
2 outbuildings
Land
55 m2
-Sols
2025-04-08
45 000 
210  /m²(214 m²)
274  /m²(164 m²)
Sale
Apartments
Apartment
8 rooms
164 m2
Commercial property
50 m2
2 outbuildings
Land
107 m2
-Sols
2025-01-08
62 000 
443  /m²(140 m²)
Auction
Houses
House
7 rooms
140 m2
2 outbuildings
Land
227 m2
-Jardins
/Jardin potager
Land
224 m2
-Jardins
/Jardin potager
Land
47 m2
-Sols
2024-12-26
70 000 
1 029  /m²(68 m²)
Sale
Houses
House
3 rooms
68 m2
Land
55 m2
-Sols
2024-12-20
156 000 
1 486  /m²(105 m²)
Sale
Houses
House
4 rooms
105 m2
1 outbuilding
Land
96 m2
-Sols
Land
2647 m2
-Taillis sous futaie
Land
144 m2
-Sols
Land
2180 m2
-Prés
2024-12-20
38 000 
Sale
Land
948 m2
-Terrains à bâtir
2024-12-19
83 255 
Sale
Land
9810 m2
-Taillis simples
Land
25520 m2
-Terres
Land
6095 m2
-Prés
Land
27350 m2
-Prés
Land
10400 m2
-Terres
Land
44170 m2
-Prés
Land
9345 m2
-Terres
Land
8385 m2
-Terres
Land
3545 m2
-Prés
Land
32540 m2
-Prés
Land
13345 m2
-Pâtures
/Pâture plantée
Land
15140 m2
-Taillis simples
Land
5100 m2
-Prés
Land
5820 m2
-Prés
Land
5387 m2
-Terres
Land
8503 m2
-Prés
Land
7200 m2
-Taillis sous futaie
Land
21380 m2
-Prés
Land
735 m2
-Taillis simples
Land
8280 m2
-Prés
2024-12-10
41 500 
741  /m²(56 m²)
Sale
Houses
House
2 rooms
56 m2
Land
600 m2
-Sols
2024-11-08
20 000 
Sale
Land
495 m2
-Jardins
/Jardin potager
2024-10-03
37 000 
158  /m²(234 m²)
222  /m²(167 m²)
Sale
Apartments
Apartment
1 room
27 m2
Apartments
Apartment
3 rooms
57 m2
Apartments
Apartment
3 rooms
56 m2
Apartments
Apartment
1 room
27 m2
Commercial property
17 m2
Commercial property
50 m2
4 outbuildings
Land
78 m2
-Sols
2024-09-12
240 045 
1 356  /m²(177 m²)
Sale
Houses
House
5 rooms
177 m2
1 outbuilding
Land
7620 m2
-Pâtures
Land
1380 m2
-Sols
2024-09-05
55 000 
220  /m²(250 m²)
Sale
Commercial property
250 m2
Land
486 m2
-Sols
2024-09-04
37 000 
182  /m²(203 m²)
Auction
Houses
House
4 rooms
100 m2
Houses
House
4 rooms
103 m2
2 outbuildings
Land
921 m2
-Sols
Land
1000 m2
-Jardins
/Jardin potager
Land
159 m2
-Sols
2024-08-29
173 700 
2 316  /m²(75 m²)
Sale
Houses
House
4 rooms
75 m2
1 outbuilding
Land
340 m2
-Sols
1 outbuilding
Land
1465 m2
-Terrains d'agrément
Land
1327 m2
-Prés
Land
378 m2
-Prés
Land
242 m2
-Sols
2024-08-05
189 500 
1 723  /m²(110 m²)
Sale
Houses
House
5 rooms
110 m2
1 outbuilding
Land
500 m2
-Sols
Land
1045 m2
-Terrains d'agrément
2024-07-25
46 600 
863  /m²(54 m²)
Sale
Houses
House
3 rooms
54 m2
Land
294 m2
-Sols
2024-07-19
6 782 
Sale
Land
21997 m2
-Taillis sous futaie
Land
611 m2
-Pâtures
340 transactions listed in the municipality

Loire (42)

Most expensive cities

City
name
Descending orderHouses
house
Price per m²
3 194 
3 023 
2 973 
2 928 
2 927 
2 924 
2 905 
City
name
Descending orderApartments
apt.
Price per m²
3 361 
2 413 
2 363 
2 359 
2 220 

Least expensive cities

City
name
Ascending orderHouses
house
Price per m²
737 
755 
772 
774 
City
name
Ascending orderApartments
apt.
Price per m²
178 
255 
287 
304