Median price of real estate
in the municipality of Panissières
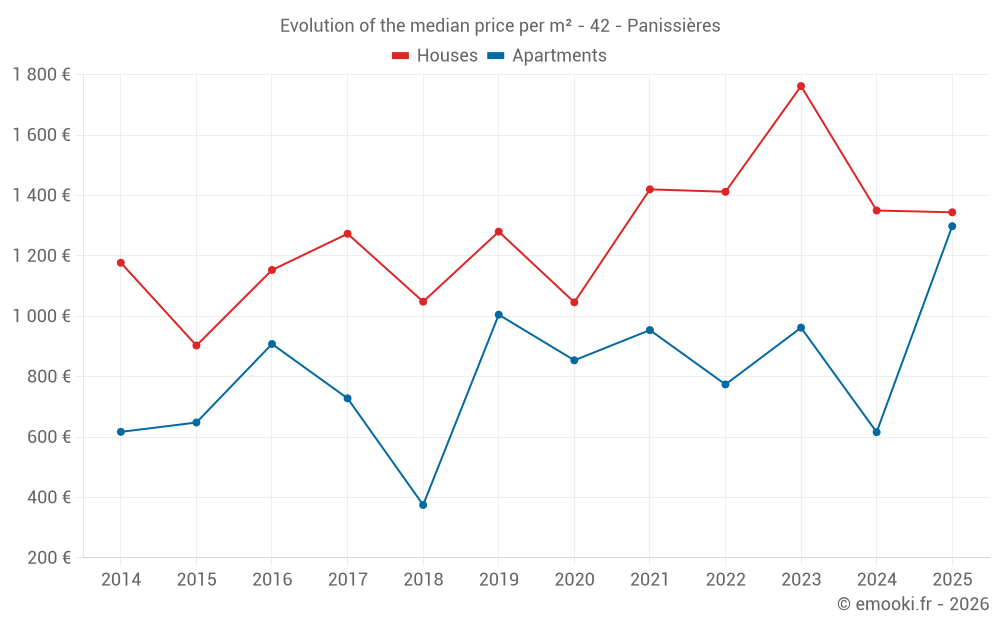
Houses
1 364 € /m²
Reliability 8/10
Median price on the 34 transactions of the last 12 months.
from 922 to
2 029 € /m²
2 029 € /m²
60% of transactions from the 2nd to the 8th deciles.
Apartments
774 € /m²
Reliability 6/10
Median price on the 21 transactions of the last 36 months.
from 595 to
1 877 € /m²
1 877 € /m²
60% of transactions from the 2nd to the 8th deciles.
Dwellings
1 322 € /m²
Reliability 8/10
Median price on the 38 transactions of the last 12 months.
from 847 to
2 016 € /m²
2 016 € /m²
60% of transactions from the 2nd to the 8th deciles.