emooki
HomePrice mapTransactions
🇬🇧 English🇫🇷 Français🇩🇪 Deutsch🇪🇸 Español🇮🇹 Italiano

Real estate price map


Real estate price map in the municipality of Jonzieux, choose a section to see transactions by parcel.

Loire (42)

Jonzieux - Real estate price m²

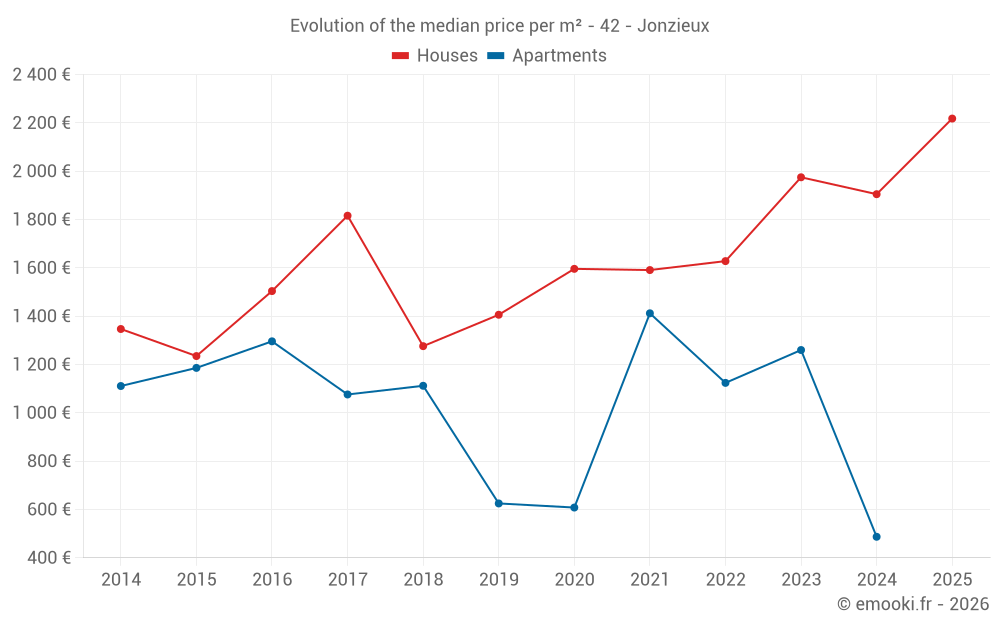
Median price of real estate
in the municipality of Jonzieux

HousesHouses
1 863  /m²
1-23-45-67-89-10
Reliability 7/10
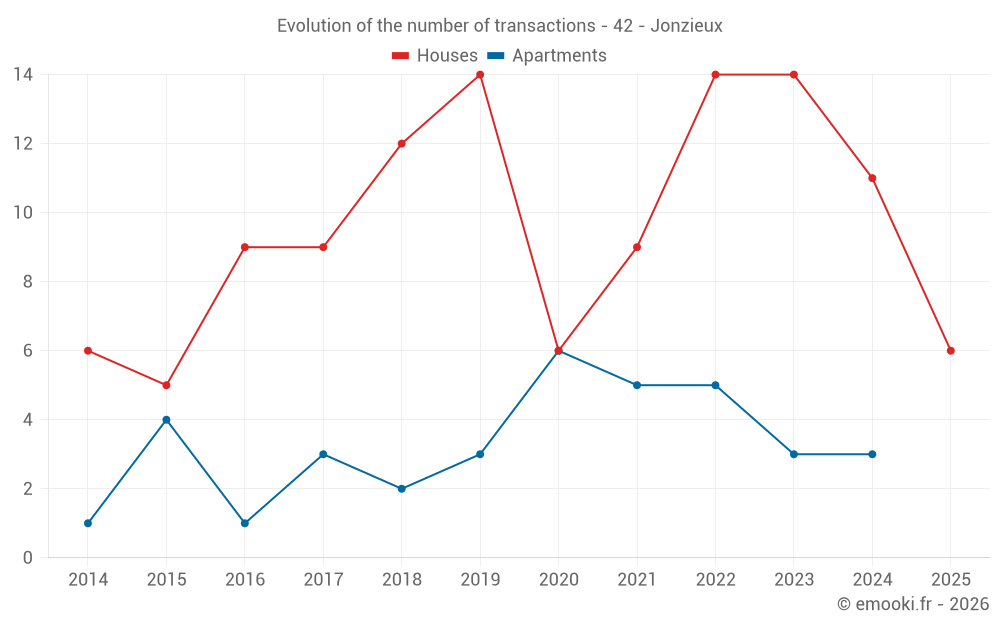
Median price on the 25 transactions of the last 24 months.
from 1 208 to
2 559  /m²
60% of transactions from the 2nd to the 8th deciles.
ApartmentsApartments
1 136  /m²
1-23-45-67-89-10
Reliability 5/10
Median price on the 12 transactions of the last 48 months.
from 894 to
1 439  /m²
60% of transactions from the 2nd to the 8th deciles.
DwellingsDwellings
1 524  /m²
1-23-45-67-89-10
Reliability 7/10
Median price on the 30 transactions of the last 24 months.
from 1 090 to
2 350  /m²
60% of transactions from the 2nd to the 8th deciles.
HousesEvolution of the price per m² of houses since...
1 year
+16%
2 years
+12%
3 years
+36%
4 years
+39%
5 years
+39%
6 years
+58%
7 years
+74%
8 years
+22%
9 years
+47%
10 years
+80%
11 years
+65%

Yearly evolution

Evolution of the median price per m²

Evolution of the median price per m² - 42 - Jonzieux

Evolution of the number of transactions

Warning, last year incomplete. Projections made based on the proportions between semesters of the previous year at the departmental/national level and by type of property.

Evolution of the number of transactions - 42 - Jonzieux

Yearly data

Descending order
Year
Houses
house
transactions
Houses
house
Price per m²
Apartments
apt.
transactions
Apartments
apt.
Price per m²
2025
6
2 218 
0
--- 
2024
11
1 905 
3
487 
2023
14
1 975 
3
1 260 
2022
14
1 628 
5
1 124 
2021
9
1 591 
5
1 412 
2020
6
1 596 
6
608 
2019
14
1 406 
3
625 
2018
12
1 276 
2
1 112 
2017
9
1 816 
3
1 076 
2016
9
1 504 
1
1 296 
2015
5
1 235 
4
1 186 
2014
6
1 347 
1
1 111 

Analysis

Structure of prices per m²

Values of price percentiles per m² over the periods used for the estimated price of each type of property.

Structure of transaction amounts

Values of transaction amounts percentiles over the periods used for the estimated price of each type of property.

Transaction amounts and prices per m² by percentile

Ascending order
Percentile
Houses
house
Price per m²
Houses
house
Transaction amount
Apartments
apt.
Price per m²
Apartments
apt.
Transaction amount
10th percentile
1 073 
92 800 
526 
85 420 
20th percentile
1 208 
116 K
894 
89 360 
30th percentile
1 351 
141 K
984 
90 600 
40th percentile
1 534 
156 K
1 072 
95 200 
50th percentile
1 863 
195 K
1 136 
100 K
60th percentile
1 999 
207 K
1 216 
122 K
70th percentile
2 179 
220 K
1 348 
144 K
80th percentile
2 559 
239 K
1 439 
161 K
90th percentile
2 709 
281 K
1 520 
225 K

National and departmental comparison

Evolution of the median price per m² of houses

Evolution of the median price per m² of apartments

Quarterly evolution

Evolution of the median price per m²

Evolution of the number of transactions

Quarterly data

Descending order
Quarter
Houses
house
transactions
Houses
house
Price per m²
Apartments
apt.
transactions
Apartments
apt.
Price per m²
2025 Q2
1
1 154 
0
--- 
2025 Q1
5
2 573 
0
--- 
2024 Q4
1
2 072 
0
--- 
2024 Q3
3
2 299 
1
877 
2024 Q2
4
1 044 
1
487 
2024 Q1
3
1 573 
1
273 
2023 Q4
5
1 856 
1
1 149 
2023 Q3
3
1 254 
1
1 260 
2023 Q2
2
2 104 
0
--- 
2023 Q1
4
2 324 
1
1 385 
2022 Q4
5
1 786 
0
--- 
2022 Q3
3
1 247 
3
1 124 
2022 Q2
3
989 
2
1 245 
2022 Q1
3
2 333 
0
--- 
2021 Q4
3
2 286 
0
--- 
2021 Q3
2
1 822 
1
1 453 
2021 Q2
2
1 107 
1
1 222 
2021 Q1
2
1 452 
3
1 412 
2020 Q4
1
1 636 
0
--- 
2020 Q3
3
1 600 
4
608 
2020 Q2
0
--- 
1
484 
2020 Q1
2
1 475 
1
1 058 
2019 Q4
5
1 667 
0
--- 
2019 Q3
3
1 345 
2
460 
2019 Q2
2
1 053 
1
1 222 
2019 Q1
4
1 664 
0
--- 
2018 Q4
2
1 016 
0
--- 
2018 Q3
8
1 276 
0
--- 
2018 Q2
1
2 065 
0
--- 
2018 Q1
1
757 
2
1 112 
2017 Q4
4
1 584 
1
1 076 
2017 Q3
4
2 158 
2
835 
2017 Q2
1
2 321 
0
--- 
2016 Q4
2
1 464 
0
--- 
2016 Q3
4
1 764 
0
--- 
2016 Q2
2
1 615 
1
1 296 
2016 Q1
1
1 007 
0
--- 
2015 Q4
1
1 235 
1
1 231 
2015 Q3
1
1 040 
1
1 188 
2015 Q2
1
1 067 
0
--- 
2015 Q1
2
1 590 
2
974 
2014 Q4
1
1 404 
0
--- 
2014 Q3
1
1 873 
1
1 111 
2014 Q2
3
1 290 
0
--- 
2014 Q1
1
622 
0
--- 

Overview of the latest real estate transactions

The following list is an anonymized overview of the latest transactions. For more details and to find all transactions, please use the map to view transactions by plot or the transaction search page for a search by criteria.

2025-06-13
9 147 
Sale
Land
12020 m2
-Prés
Land
1360 m2
-Terres
Land
3730 m2
-Terres
2025-04-24
60 000 
1 154  /m²(52 m²)
Sale
Houses
House
2 rooms
52 m2
1 outbuilding
Land
620 m2
-Sols
Land
1335 m2
-Prés
2025-03-28
145 300 
1 863  /m²(78 m²)
Sale
Houses
House
2 rooms
78 m2
Land
149 m2
-Sols
2025-02-11
95 000 
Sale
Land
430 m2
-Prés
Land
366 m2
-Prés
Land
953 m2
-Prés
2025-02-05
233 000 
2 709  /m²(86 m²)
Sale
Houses
House
3 rooms
86 m2
Land
828 m2
-Sols
Land
1200 m2
-Terrains d'agrément
2025-01-14
211 000 
2 573  /m²(82 m²)
Sale
Houses
House
4 rooms
82 m2
Land
989 m2
-Sols
2025-01-09
380 000 
3 800  /m²(100 m²)
Sale
Houses
House
4 rooms
100 m2
1 outbuilding
Land
1040 m2
-Sols
Land
1310 m2
-Prés
Land
590 m2
-Pâtures
/Pâture plantée
2025-01-08
204 950 
1 331  /m²(154 m²)
Sale
Houses
House
6 rooms
154 m2
1 outbuilding
Land
1101 m2
-Sols
2024-12-27
65 000 
1 226  /m²(53 m²)
Sale
Apartments
Apartment
2 rooms
53 m2
Land
5680 m2
-Futaies résineuses
/Sapins ou sapinière
2024-12-23
230 000 
2 072  /m²(111 m²)
Sale
Houses
House
5 rooms
111 m2
Land
899 m2
-Sols
2024-12-20
14 260 
Sale
Land
48 m2
-Sols
Land
17992 m2
-Prés
Land
12175 m2
-Prés
Land
4310 m2
-Prés
Land
768 m2
-Prés
Land
10785 m2
-Prés
Land
10245 m2
-Prés
Land
5835 m2
-Prés
2024-08-02
20 000 
Sale
Land
404 m2
-Sols
2024-08-02
200 000 
2 299  /m²(87 m²)
Sale
Houses
House
4 rooms
87 m2
1 outbuilding
Land
795 m2
-Sols
2024-07-23
195 000 
2 708  /m²(72 m²)
Sale
Houses
House
3 rooms
72 m2
Land
227 m2
-Sols
2024-07-09
136 000 
877  /m²(155 m²)
Sale
Apartments
Apartment
3 rooms
60 m2
Apartments
Apartment
3 rooms
60 m2
Apartments
Apartment
2 rooms
35 m2
Land
257 m2
-Sols
2024-07-03
281 000 
1 951  /m²(144 m²)
Sale
Houses
House
5 rooms
144 m2
2 outbuildings
Land
1456 m2
-Sols
Land
978 m2
-Terres
2024-06-27
138 000 
2 156  /m²(64 m²)
Sale
Houses
House
2 rooms
64 m2
1 outbuilding
Land
975 m2
-Terrains d'agrément
Land
500 m2
-Sols
2024-06-27
90 000 
865  /m²(104 m²)
Sale
Houses
House
5 rooms
104 m2
Land
129 m2
-Sols
2024-05-17
220 000 
1 222  /m²(180 m²)
Sale
Houses
House
6 rooms
180 m2
Land
1078 m2
-Sols
2024-05-15
31 700 
Sale
Land
26440 m2
-Futaies résineuses
/Sapins ou sapinière
239 transactions listed in the municipality

Loire (42)

Most expensive cities

City
name
Descending orderHouses
house
Price per m²
3 194 
3 023 
2 973 
2 928 
2 927 
2 924 
2 905 
City
name
Descending orderApartments
apt.
Price per m²
3 361 
2 413 
2 363 
2 359 
2 220 

Least expensive cities

City
name
Ascending orderHouses
house
Price per m²
737 
755 
772 
774 
City
name
Ascending orderApartments
apt.
Price per m²
178 
255 
287 
304