emooki
HomePrice mapTransactions
🇬🇧 English🇫🇷 Français🇩🇪 Deutsch🇪🇸 Español🇮🇹 Italiano

Real estate price map


Real estate price map in the municipality of Belmont-de-la-Loire, choose a section to see transactions by parcel.

Loire (42)

Belmont-de-la-Loire - Real estate price m²

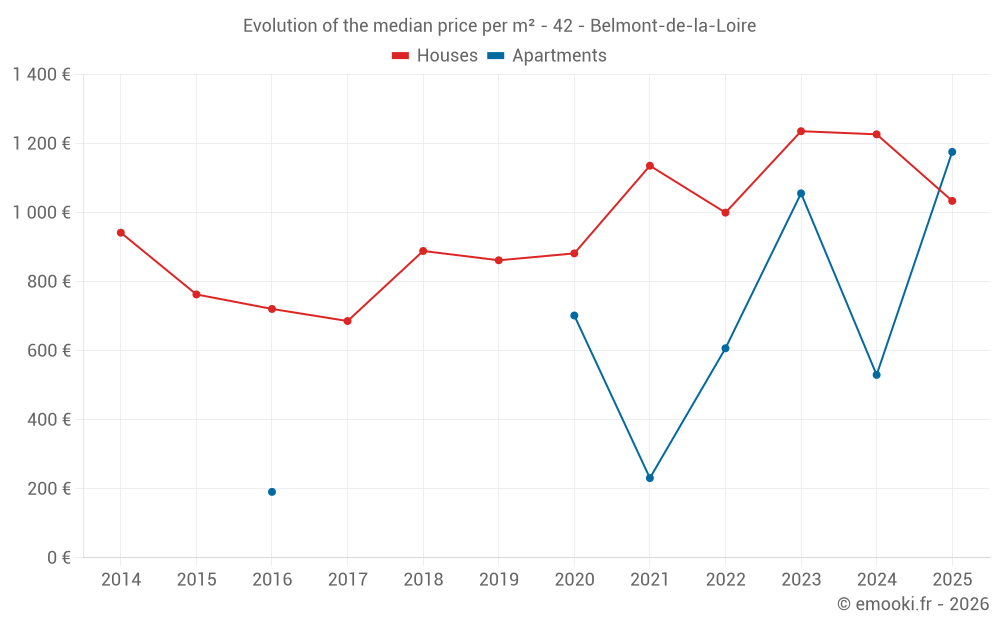
Median price of real estate
in the municipality of Belmont-de-la-Loire

HousesHouses
1 217  /m²
1-23-45-67-89-10
Reliability 7/10
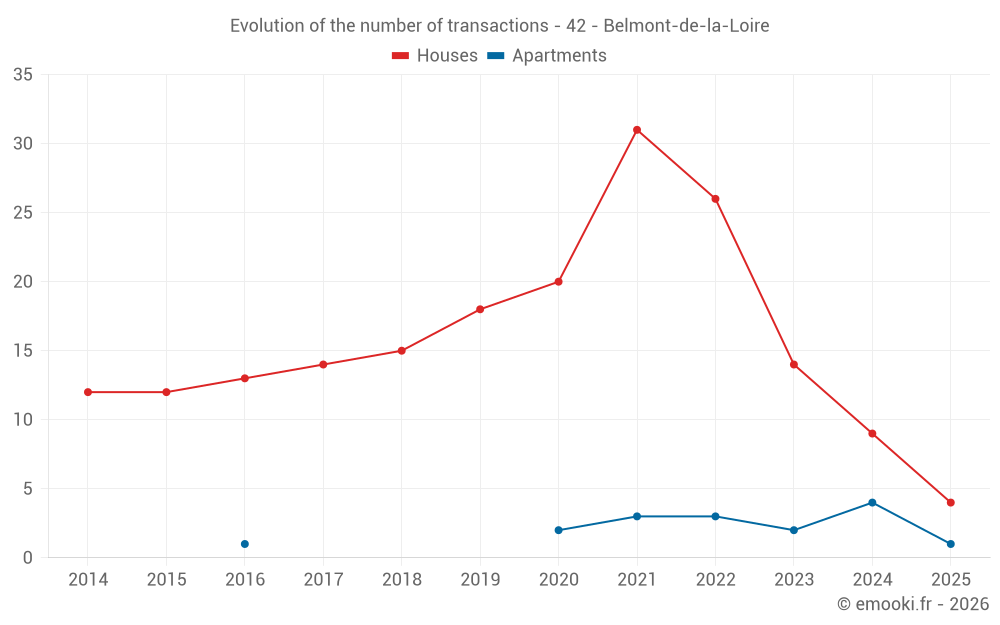
Median price on the 21 transactions of the last 24 months.
from 739 to
1 521  /m²
60% of transactions from the 2nd to the 8th deciles.
ApartmentsApartments
607  /m²
1-23-45-67-89-10
Reliability 5/10
Median price on the 11 transactions of the last 48 months.
from 369 to
1 006  /m²
60% of transactions from the 2nd to the 8th deciles.
DwellingsDwellings
1 000  /m²
1-23-45-67-89-10
Reliability 7/10
Median price on the 27 transactions of the last 24 months.
from 678 to
1 492  /m²
60% of transactions from the 2nd to the 8th deciles.
HousesEvolution of the price per m² of houses since...
1 year
-16%
2 years
-16%
3 years
+3.4%
4 years
-9%
5 years
+17%
6 years
+20%
7 years
+16%
8 years
+51%
9 years
+43%
10 years
+36%
11 years
+10%
The price per m² of houses has decreased by 16% since 2 years, but it has increased by 51% in 8 years.

Yearly evolution

Evolution of the median price per m²

Evolution of the median price per m² - 42 - Belmont-de-la-Loire

Evolution of the number of transactions

Warning, last year incomplete. Projections made based on the proportions between semesters of the previous year at the departmental/national level and by type of property.

Evolution of the number of transactions - 42 - Belmont-de-la-Loire

Yearly data

Descending order
Year
Houses
house
transactions
Houses
house
Price per m²
Apartments
apt.
transactions
Apartments
apt.
Price per m²
2025
4
1 034 
1
1 176 
2024
9
1 227 
4
530 
2023
14
1 236 
2
1 056 
2022
26
1 000 
3
607 
2021
31
1 136 
3
231 
2020
20
882 
2
702 
2019
18
862 
0
--- 
2018
15
889 
0
--- 
2017
14
686 
0
--- 
2016
13
721 
1
191 
2015
12
763 
0
--- 
2014
12
942 
0
--- 

Analysis

Structure of prices per m²

Values of price percentiles per m² over the periods used for the estimated price of each type of property.

Structure of transaction amounts

Values of transaction amounts percentiles over the periods used for the estimated price of each type of property.

Transaction amounts and prices per m² by percentile

Ascending order
Percentile
Houses
house
Price per m²
Houses
house
Transaction amount
Apartments
apt.
Price per m²
Apartments
apt.
Transaction amount
10th percentile
669 
57 000 
231 
48 000 
20th percentile
739 
66 860 
369 
55 000 
30th percentile
852 
88 000 
416 
70 000 
40th percentile
943 
100 K
441 
75 000 
50th percentile
1 217 
112 K
607 
78 800 
60th percentile
1 255 
146 K
643 
90 000 
70th percentile
1 337 
155 K
716 
114 K
80th percentile
1 521 
207 K
1 006 
120 K
90th percentile
1 782 
242 K
1 176 
158 K

National and departmental comparison

Evolution of the median price per m² of houses

Evolution of the median price per m² of apartments

Quarterly evolution

Evolution of the median price per m²

Evolution of the number of transactions

Quarterly data

Descending order
Quarter
Houses
house
transactions
Houses
house
Price per m²
Apartments
apt.
transactions
Apartments
apt.
Price per m²
2025 Q1
4
1 034 
1
1 176 
2024 Q4
3
1 000 
1
716 
2024 Q3
2
1 032 
1
643 
2024 Q2
1
1 337 
2
309 
2024 Q1
3
1 952 
0
--- 
2023 Q4
4
962 
1
1 744 
2023 Q3
4
1 159 
0
--- 
2023 Q2
4
1 196 
0
--- 
2023 Q1
2
1 428 
1
369 
2022 Q4
9
1 143 
1
1 006 
2022 Q3
5
1 028 
1
607 
2022 Q2
6
806 
1
441 
2022 Q1
6
898 
0
--- 
2021 Q4
8
1 174 
1
231 
2021 Q3
5
533 
0
--- 
2021 Q2
9
1 789 
2
384 
2021 Q1
9
980 
0
--- 
2020 Q4
9
1 230 
1
904 
2020 Q3
6
856 
1
500 
2020 Q2
3
882 
0
--- 
2020 Q1
2
569 
0
--- 
2019 Q4
6
1 225 
0
--- 
2019 Q3
6
862 
0
--- 
2019 Q2
2
806 
0
--- 
2019 Q1
4
503 
0
--- 
2018 Q4
4
652 
0
--- 
2018 Q3
1
750 
0
--- 
2018 Q2
5
1 237 
0
--- 
2018 Q1
5
842 
0
--- 
2017 Q4
4
614 
0
--- 
2017 Q3
5
779 
0
--- 
2017 Q2
4
515 
0
--- 
2017 Q1
1
653 
0
--- 
2016 Q4
5
653 
1
191 
2016 Q3
1
514 
0
--- 
2016 Q2
2
690 
0
--- 
2016 Q1
5
1 000 
0
--- 
2015 Q4
3
509 
0
--- 
2015 Q3
4
442 
0
--- 
2015 Q2
3
1 316 
0
--- 
2015 Q1
2
1 112 
0
--- 
2014 Q4
3
944 
0
--- 
2014 Q3
2
1 050 
0
--- 
2014 Q2
5
941 
0
--- 
2014 Q1
2
680 
0
--- 

Overview of the latest real estate transactions

The following list is an anonymized overview of the latest transactions. For more details and to find all transactions, please use the map to view transactions by plot or the transaction search page for a search by criteria.

2025-06-05
750 
Sale
Land
3899 m2
-Futaies résineuses
/Pins
Land
174 m2
-Futaies résineuses
/Pins
2025-05-28
100 
Sale
Land
237 m2
-Prés
2025-05-27
300 
Sale
Land
770 m2
-Futaies résineuses
/Sapins ou sapinière
Land
1225 m2
-Futaies résineuses
/Sapins ou sapinière
2025-05-16
8 464 
Sale
Land
1058 m2
-Prés
2025-05-07
25 296 
Sale
Land
742 m2
-Terres
Land
2 m2
-Terres
2025-04-30
815 
Sale
Land
991 m2
-Terres
Land
1268 m2
-Taillis sous futaie
Land
3174 m2
-Futaies résineuses
/Sapins ou sapinière
2025-04-29
650 
Sale
Land
1675 m2
-Prés
Land
2259 m2
-Prés
2025-04-29
3 000 
Sale
Land
1010 m2
-Taillis simples
Land
1260 m2
-Prés
Land
15866 m2
-Prés
2025-04-29
2 350 
Sale
Land
596 m2
-Sols
Land
14934 m2
-Prés
2025-04-14
4 822 
Sale
Land
1989 m2
-Prés
Land
20 m2
-Prés
Land
106 m2
-Prés
Land
1861 m2
-Prés
Land
3821 m2
-Pâtures
/Pâture plantée
2025-04-01
7 000 
Sale
Land
11340 m2
-Futaies résineuses
/Sapins ou sapinière
2025-03-28
120 000 
1 176  /m²(102 m²)
Sale
Apartments
Apartment
3 rooms
50 m2
Apartments
Apartment
3 rooms
52 m2
2 outbuildings
Land
114 m2
-Sols
Land
100 m2
-Sols
Land
21 m2
-Jardins
Land
1 m2
-Jardins
Land
4 m2
-Jardins
Land
36 m2
-Sols
Land
9 m2
-Sols
2025-03-27
155 000 
852  /m²(182 m²)
Sale
Houses
House
6 rooms
182 m2
Land
492 m2
-Landes
Land
507 m2
-Landes
Land
2645 m2
-Terres
2025-03-11
14 500 
Sale
Land
5210 m2
-Futaies résineuses
/Sapins ou sapinière
2025-02-27
450 
Sale
Land
1365 m2
-Taillis simples
2025-02-27
150 
Sale
Land
555 m2
-Taillis simples
2025-02-27
146 000 
1 217  /m²(120 m²)
Sale
Houses
House
5 rooms
120 m2
1 outbuilding
Land
540 m2
-Sols
Land
1743 m2
-Prés
Land
207 m2
-Prés
Land
12 m2
-Pâtures
/Pâture plantée
2025-02-14
16 384 
Sale
Land
284 m2
-Terres
Land
228 m2
-Terres
2025-02-14
6 400 
Sale
Land
180 m2
-Terres
Land
20 m2
-Terres
2025-02-14
228 200 
1 521  /m²(150 m²)
Sale
Houses
House
4 rooms
150 m2
1 outbuilding
Land
267 m2
-Sols
Land
4700 m2
-Prés
756 transactions listed in the municipality

Loire (42)

Most expensive cities

City
name
Descending orderHouses
house
Price per m²
3 194 
3 023 
2 973 
2 928 
2 927 
2 924 
2 905 
City
name
Descending orderApartments
apt.
Price per m²
3 361 
2 413 
2 363 
2 359 
2 220 

Least expensive cities

City
name
Ascending orderHouses
house
Price per m²
737 
755 
772 
774 
City
name
Ascending orderApartments
apt.
Price per m²
178 
255 
287 
304