emooki
HomePrice mapTransactions
🇬🇧 English🇫🇷 Français🇩🇪 Deutsch🇪🇸 Español🇮🇹 Italiano

Real estate price map


Real estate price map in the municipality of Plateau-des-Petites-Roches, choose a section to see transactions by parcel.

Isère (38)

Plateau-des-Petites-Roches - Real estate price m²

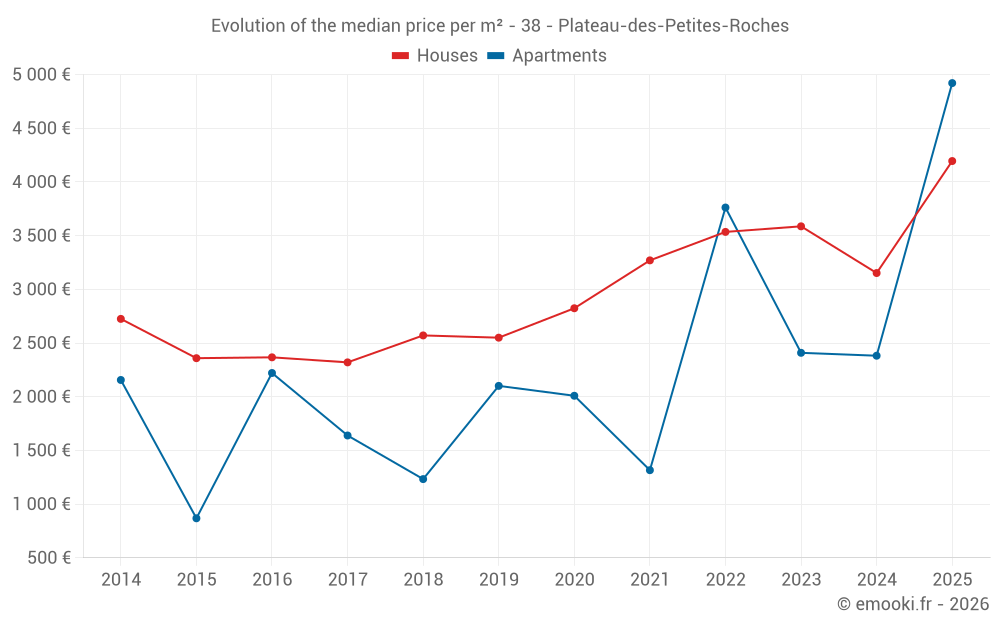
Median price of real estate
in the municipality of Plateau-des-Petites-Roches

HousesHouses
3 519  /m²
1-23-45-67-89-10
Reliability 7/10
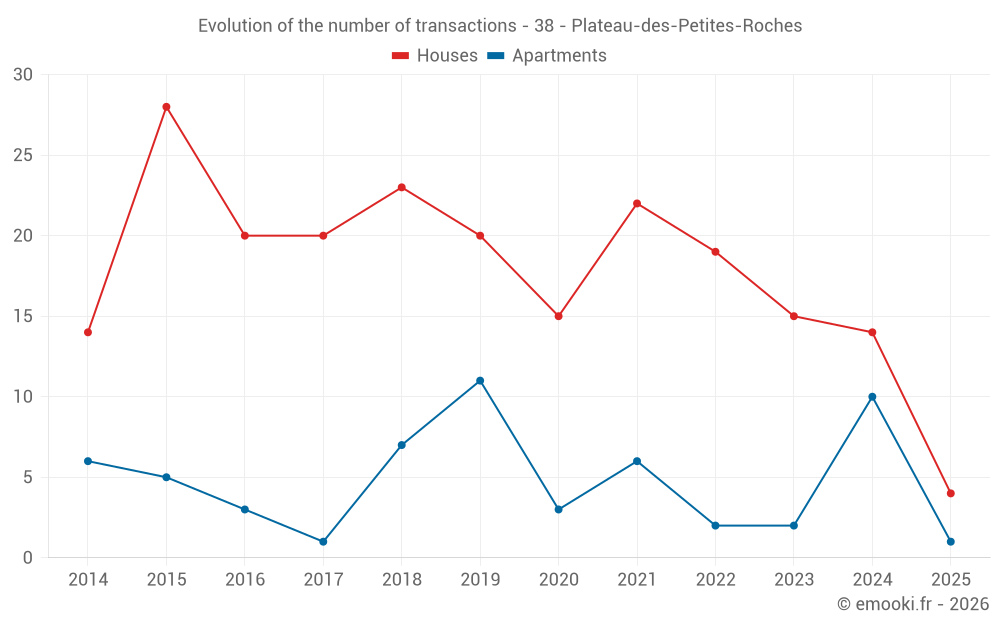
Median price on the 28 transactions of the last 24 months.
from 2 897 to
4 556  /m²
60% of transactions from the 2nd to the 8th deciles.
ApartmentsApartments
2 534  /m²
1-23-45-67-89-10
Reliability 6/10
Median price on the 13 transactions of the last 36 months.
from 1 826 to
3 722  /m²
60% of transactions from the 2nd to the 8th deciles.
DwellingsDwellings
3 342  /m²
1-23-45-67-89-10
Reliability 8/10
Median price on the 17 transactions of the last 12 months.
from 2 101 to
4 386  /m²
60% of transactions from the 2nd to the 8th deciles.
HousesEvolution of the price per m² of houses since...
1 year
+33%
2 years
+17%
3 years
+19%
4 years
+28%
5 years
+49%
6 years
+65%
7 years
+63%
8 years
+81%
9 years
+77%
10 years
+78%
11 years
+54%

Yearly evolution

Evolution of the median price per m²

Evolution of the median price per m² - 38 - Plateau-des-Petites-Roches

Evolution of the number of transactions

Warning, last year incomplete. Projections made based on the proportions between semesters of the previous year at the departmental/national level and by type of property.

Evolution of the number of transactions - 38 - Plateau-des-Petites-Roches

Yearly data

Descending order
Year
Houses
house
transactions
Houses
house
Price per m²
Apartments
apt.
transactions
Apartments
apt.
Price per m²
2025
4
4 195 
1
4 921 
2024
14
3 152 
10
2 382 
2023
15
3 587 
2
2 409 
2022
19
3 535 
2
3 762 
2021
22
3 270 
6
1 316 
2020
15
2 824 
3
2 009 
2019
20
2 550 
11
2 101 
2018
23
2 571 
7
1 233 
2017
20
2 320 
1
1 639 
2016
20
2 367 
3
2 221 
2015
28
2 359 
5
868 
2014
14
2 725 
6
2 156 

Analysis

Structure of prices per m²

Values of price percentiles per m² over the periods used for the estimated price of each type of property.

Structure of transaction amounts

Values of transaction amounts percentiles over the periods used for the estimated price of each type of property.

Transaction amounts and prices per m² by percentile

Ascending order
Percentile
Houses
house
Price per m²
Houses
house
Transaction amount
Apartments
apt.
Price per m²
Apartments
apt.
Transaction amount
10th percentile
2 246 
175 K
1 662 
97 282 
20th percentile
2 897 
270 K
1 826 
98 646 
30th percentile
3 071 
286 K
1 876 
106 K
40th percentile
3 360 
327 K
2 165 
112 K
50th percentile
3 519 
375 K
2 534 
116 K
60th percentile
3 917 
389 K
3 058 
131 K
70th percentile
4 173 
465 K
3 404 
161 K
80th percentile
4 556 
495 K
3 722 
193 K
90th percentile
4 798 
534 K
4 715 
219 K

National and departmental comparison

Evolution of the median price per m² of houses

Evolution of the median price per m² of apartments

Quarterly evolution

Evolution of the median price per m²

Evolution of the number of transactions

Quarterly data

Descending order
Quarter
Houses
house
transactions
Houses
house
Price per m²
Apartments
apt.
transactions
Apartments
apt.
Price per m²
2025 Q2
3
3 877 
0
--- 
2025 Q1
1
5 478 
1
4 921 
2024 Q4
3
3 342 
2
1 705 
2024 Q3
7
2 920 
0
--- 
2024 Q2
2
2 235 
4
2 382 
2024 Q1
2
4 394 
4
3 680 
2023 Q4
2
4 738 
2
2 409 
2023 Q3
8
4 110 
0
--- 
2023 Q2
3
3 471 
0
--- 
2023 Q1
2
3 275 
0
--- 
2022 Q4
6
4 036 
0
--- 
2022 Q3
2
3 936 
0
--- 
2022 Q2
5
3 004 
0
--- 
2022 Q1
6
3 884 
2
3 762 
2021 Q4
4
2 284 
2
804 
2021 Q3
7
3 563 
2
2 083 
2021 Q2
5
3 697 
1
3 023 
2021 Q1
6
2 688 
1
1 065 
2020 Q4
3
2 505 
1
2 009 
2020 Q3
4
2 830 
2
1 850 
2020 Q2
6
3 070 
0
--- 
2020 Q1
2
2 334 
0
--- 
2019 Q4
5
2 471 
1
2 292 
2019 Q3
5
2 885 
3
1 471 
2019 Q2
6
2 370 
3
1 446 
2019 Q1
4
2 409 
4
2 315 
2018 Q4
8
2 500 
5
1 233 
2018 Q3
9
2 742 
1
1 003 
2018 Q2
4
4 107 
1
1 848 
2018 Q1
2
2 204 
0
--- 
2017 Q4
5
2 243 
0
--- 
2017 Q3
5
2 286 
1
1 639 
2017 Q2
6
1 935 
0
--- 
2017 Q1
4
3 070 
0
--- 
2016 Q4
8
2 744 
0
--- 
2016 Q3
4
2 879 
2
1 777 
2016 Q2
7
1 600 
1
2 267 
2016 Q1
1
2 333 
0
--- 
2015 Q4
8
2 994 
1
868 
2015 Q3
10
2 413 
1
629 
2015 Q2
4
2 202 
1
2 342 
2015 Q1
6
2 618 
2
925 
2014 Q4
3
2 398 
3
1 533 
2014 Q3
2
1 900 
1
3 750 
2014 Q2
4
2 739 
1
3 621 
2014 Q1
5
2 818 
1
561 

Overview of the latest real estate transactions

The following list is an anonymized overview of the latest transactions. For more details and to find all transactions, please use the map to view transactions by plot or the transaction search page for a search by criteria.

2025-06-25
1 453 
Sale
Land
690 m2
-Prés
Land
3100 m2
-Prés
2025-06-23
142 
Sale
Land
1180 m2
-Taillis simples
2025-05-13
180 505 
4 513  /m²(40 m²)
Sale
Houses
House
3 rooms
40 m2
1 outbuilding
Land
322 m2
-Terrains d'agrément
Land
314 m2
-Sols
Land
49 m2
-Sols
2025-04-29
290 000 
3 718  /m²(78 m²)
Sale
Houses
House
3 rooms
78 m2
Land
415 m2
-Sols
2025-04-07
504 000 
3 877  /m²(130 m²)
Sale
Houses
House
4 rooms
130 m2
Land
1000 m2
-Sols
Land
500 m2
-Terrains d'agrément
Land
205 m2
-Prés
Land
48 m2
-Prés
2025-03-25
85 000 
Sale
1 outbuilding
Land
617 m2
-Sols
2025-03-24
1 100 
Sale
Land
2443 m2
-Taillis simples
Land
1190 m2
-Taillis simples
2025-03-03
125 000 
Sale
Land
281 m2
-Sols
Land
318 m2
-Sols
Land
600 m2
-Terrains à bâtir
2025-02-18
126 000 
5 478  /m²(23 m²)
Sale
Houses
House
1 room
23 m2
2025-02-13
98 410 
4 921  /m²(20 m²)
Sale
Apartments
Apartment
2 rooms
20 m2
1 outbuilding
Land
17 m2
-Sols
2025-02-05
1 230 
Sale
Land
1860 m2
-Pâtures
Land
260 m2
-Pâtures
Land
1980 m2
-Pâtures
2025-02-05
2 196 
Sale
Land
1860 m2
-Pâtures
Land
260 m2
-Pâtures
Land
1980 m2
-Pâtures
2025-01-21
1 200 
Sale
Land
5360 m2
-Futaies résineuses
2025-01-15
1 000 
Sale
Land
3465 m2
-Terres
2024-12-31
327 860 
3 451  /m²(95 m²)
Sale
Houses
House
4 rooms
95 m2
Land
503 m2
-Sols
2024-12-24
97 000 
1 590  /m²(61 m²)
Sale
Apartments
Apartment
4 rooms
61 m2
1 outbuilding
2024-12-20
111 000 
1 820  /m²(61 m²)
Sale
Apartments
Apartment
4 rooms
61 m2
1 outbuilding
1 outbuilding
2024-11-14
378 410 
3 027  /m²(125 m²)
Sale
Houses
House
5 rooms
125 m2
Land
695 m2
-Sols
Land
112 m2
-Sols
Land
1893 m2
-Sols
2024-11-04
240 000 
Sale
Land
395 m2
-Sols
Land
6 m2
-Sols
Land
1889 m2
-Prés
2024-10-25
381 000 
3 342  /m²(114 m²)
Sale
Houses
House
5 rooms
114 m2
Land
650 m2
-Sols
Land
620 m2
-Sols
490 transactions listed in the municipality

Isère (38)

Most expensive cities

City
name
Descending orderHouses
house
Price per m²
8 262 
4 917 
4 777 
4 663 
4 610 
4 575 
4 506 
City
name
Descending orderApartments
apt.
Price per m²
7 647 
6 370 
5 636 
4 866 
4 524 
4 492 
4 249 
4 234 
3 958 

Least expensive cities

City
name
Ascending orderHouses
house
Price per m²
502 
722 
975 
1 133 
1 198 
1 237 
City
name
Ascending orderApartments
apt.
Price per m²
475 
483 
541 
562