emooki
HomePrice mapTransactions
🇬🇧 English🇫🇷 Français🇩🇪 Deutsch🇪🇸 Español🇮🇹 Italiano

Real estate price map


Real estate price map in the municipality of Le Champ-près-Froges, choose a section to see transactions by parcel.

Isère (38)
Le Champ-près-Froges

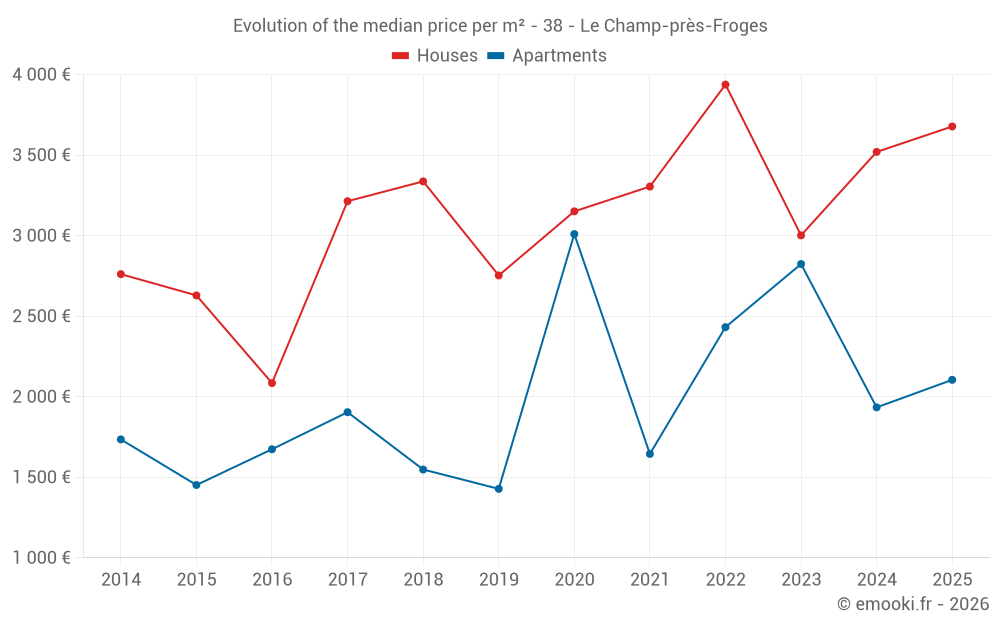
Median price of real estate
in the municipality of Le Champ-près-Froges

HousesHouses
3 606  /m²
1-23-45-67-89-10
Reliability 7/10
Median price on the 18 transactions of the last 24 months.
from 2 518 to
3 886  /m²
60% of transactions from the 2nd to the 8th deciles.
ApartmentsApartments
2 348  /m²
1-23-45-67-89-10
Reliability 6/10
Median price on the 22 transactions of the last 36 months.
from 1 747 to
3 184  /m²
60% of transactions from the 2nd to the 8th deciles.
DwellingsDwellings
3 153  /m²
1-23-45-67-89-10
Reliability 7/10
Median price on the 28 transactions of the last 24 months.
from 2 098 to
3 835  /m²
60% of transactions from the 2nd to the 8th deciles.
HousesEvolution of the price per m² of houses since...
1 year
+4.5%
2 years
+23%
3 years
-6.6%
4 years
+11%
5 years
+17%
6 years
+34%
7 years
+10%
8 years
+14%
9 years
+76%
10 years
+40%
11 years
+33%
The price per m² of houses has decreased by 6.6% since 3 years, but it has increased by 76% in 9 years.

Yearly evolution

Evolution of the median price per m²

Evolution of the number of transactions

Warning, last year incomplete. Projections made based on the proportions between semesters of the previous year at the departmental/national level and by type of property.

Yearly data

Descending order
Year
Houses
house
transactions
Houses
house
Price per m²
Apartments
apt.
transactions
Apartments
apt.
Price per m²
2025
9
3 678 
1
2 105 
2024
6
3 520 
4
1 934 
2023
9
3 002 
10
2 824 
2022
7
3 938 
10
2 432 
2021
12
3 305 
7
1 645 
2020
15
3 151 
12
3 010 
2019
5
2 753 
4
1 428 
2018
5
3 337 
7
1 548 
2017
4
3 214 
3
1 904 
2016
15
2 085 
2
1 674 
2015
11
2 629 
6
1 452 
2014
4
2 761 
2
1 735 

Analysis

Structure of prices per m²

Values of price percentiles per m² over the periods used for the estimated price of each type of property.

Structure of transaction amounts

Values of transaction amounts percentiles over the periods used for the estimated price of each type of property.

Transaction amounts and prices per m² by percentile

Ascending order
Percentile
Houses
house
Price per m²
Houses
house
Transaction amount
Apartments
apt.
Price per m²
Apartments
apt.
Transaction amount
10th percentile
2 295 
179 K
1 384 
107 K
20th percentile
2 518 
258 K
1 747 
126 K
30th percentile
3 232 
297 K
2 011 
134 K
40th percentile
3 423 
337 K
2 090 
156 K
50th percentile
3 606 
349 K
2 348 
161 K
60th percentile
3 727 
369 K
2 795 
165 K
70th percentile
3 838 
385 K
3 067 
180 K
80th percentile
3 886 
399 K
3 184 
285 K
90th percentile
4 052 
439 K
3 362 
357 K

National and departmental comparison

Evolution of the median price per m² of houses

Evolution of the median price per m² of apartments

Quarterly evolution

Evolution of the median price per m²

Evolution of the number of transactions

Quarterly data

Descending order
Quarter
Houses
house
transactions
Houses
house
Price per m²
Apartments
apt.
transactions
Apartments
apt.
Price per m²
2025 Q2
6
3 809 
1
2 105 
2025 Q1
3
3 425 
0
--- 
2024 Q4
2
3 520 
0
--- 
2024 Q3
0
--- 
1
2 080 
2024 Q2
2
2 222 
2
1 586 
2024 Q1
2
3 198 
1
2 888 
2023 Q4
1
3 533 
4
2 348 
2023 Q3
2
2 996 
1
3 137 
2023 Q2
5
2 716 
4
3 348 
2023 Q1
1
3 002 
1
1 382 
2022 Q4
1
4 333 
5
2 655 
2022 Q3
1
3 938 
2
2 370 
2022 Q2
2
3 601 
2
1 809 
2022 Q1
3
3 750 
1
3 610 
2021 Q4
3
3 998 
1
2 097 
2021 Q3
2
2 538 
2
2 074 
2021 Q2
3
2 953 
3
1 645 
2021 Q1
4
3 602 
1
1 606 
2020 Q4
5
3 332 
3
1 447 
2020 Q3
5
3 151 
5
3 270 
2020 Q2
3
2 789 
2
1 373 
2020 Q1
2
3 858 
2
2 764 
2019 Q4
2
2 483 
1
1 434 
2019 Q3
1
3 655 
1
1 316 
2019 Q2
1
3 605 
1
2 171 
2019 Q1
1
2 729 
1
1 421 
2018 Q4
2
2 749 
1
3 421 
2018 Q3
1
3 509 
3
2 332 
2018 Q2
1
460 
2
1 491 
2018 Q1
1
3 337 
1
500 
2017 Q4
2
1 940 
1
2 078 
2017 Q3
1
4 273 
0
--- 
2017 Q1
1
3 214 
2
1 829 
2016 Q4
6
2 154 
1
1 323 
2016 Q3
4
2 095 
1
2 026 
2016 Q2
2
2 036 
0
--- 
2016 Q1
3
2 000 
0
--- 
2015 Q4
4
2 073 
1
3 789 
2015 Q3
3
2 961 
1
1 427 
2015 Q2
2
2 354 
3
1 452 
2015 Q1
2
2 454 
1
1 452 
2014 Q4
1
2 637 
0
--- 
2014 Q3
1
2 885 
1
1 670 
2014 Q2
1
2 477 
1
1 800 
2014 Q1
1
4 078 
0
--- 

Overview of the latest real estate transactions

The following list is an anonymized overview of the latest transactions. For more details and to find all transactions, please use the map to view transactions by plot or the transaction search page for a search by criteria.

2025-06-17
1 180 
Sale
Land
983 m2
-Taillis simples
2025-05-22
82 000 
Sale
Land
51 m2
-Sols
2025-04-24
160 000 
2 105  /m²(76 m²)
Sale
Apartments
Apartment
4 rooms
76 m2
2 outbuildings
2025-04-23
293 600 
2 509  /m²(117 m²)
Sale
Houses
House
4 rooms
117 m2
Land
86 m2
-Sols
Land
275 m2
-Sols
Land
245 m2
-Sols
2025-04-22
373 930 
3 702  /m²(101 m²)
Sale
Houses
House
5 rooms
101 m2
1 outbuilding
Land
405 m2
-Sols
2025-04-18
270 500 
4 746  /m²(57 m²)
Sale
Houses
House
4 rooms
57 m2
1 outbuilding
Land
1290 m2
-Terres
Land
1046 m2
-Sols
Land
180 m2
-Terres
2025-04-18
436 750 
4 368  /m²(100 m²)
Sale
Houses
House
4 rooms
100 m2
2 outbuildings
Land
781 m2
-Sols
2025-04-14
250 000 
2 381  /m²(105 m²)
Sale
Houses
House
3 rooms
105 m2
2025-04-02
344 600 
3 916  /m²(88 m²)
Sale
Houses
House
5 rooms
88 m2
1 outbuilding
Land
909 m2
-Sols
Land
362 m2
-Sols
2025-03-28
444 030 
3 416  /m²(130 m²)
Sale
Houses
House
4 rooms
130 m2
1 outbuilding
Land
733 m2
-Sols
1 outbuilding
Land
458 m2
-Prés
2025-02-27
1 848 
Sale
Land
1540 m2
-Taillis simples
2025-02-27
4 487 
Sale
Land
4487 m2
-Terres
2025-02-17
352 750 
3 425  /m²(103 m²)
Sale
Houses
House
5 rooms
103 m2
Land
510 m2
-Sols
2025-01-09
217 000 
3 678  /m²(59 m²)
Sale
Houses
House
3 rooms
59 m2
Land
63 m2
-Sols
2024-12-30
150 
Sale
Land
10 m2
-Prés
2024-12-30
140 500 
Sale
Land
636 m2
-Terrains à bâtir
Land
72 m2
-Terrains à bâtir
2024-12-30
111 350 
Sale
Land
15 m2
-Terrains à bâtir
Land
676 m2
-Terrains à bâtir
Land
29 m2
-Terrains à bâtir
2024-12-30
169 000 
Sale
Land
15 m2
-Terrains à bâtir
Land
676 m2
-Terrains à bâtir
Land
29 m2
-Terrains à bâtir
2024-12-30
111 500 
Sale
Land
636 m2
-Terrains à bâtir
Land
72 m2
-Terrains à bâtir
2024-10-29
402 000 
3 829  /m²(105 m²)
Sale
Houses
House
4 rooms
105 m2
Land
1175 m2
-Sols
Land
313 m2
-Sols
Land
47 m2
-Sols
291 transactions listed in the municipality

Isère (38)

Most expensive cities

City
name
Descending orderHouses
house
Price per m²
8 262 
4 917 
4 777 
4 663 
4 610 
4 575 
4 506 
City
name
Descending orderApartments
apt.
Price per m²
7 647 
6 370 
5 636 
4 866 
4 524 
4 492 
4 249 
4 234 
3 958 

Least expensive cities

City
name
Ascending orderHouses
house
Price per m²
502 
722 
975 
1 133 
1 198 
1 237 
City
name
Ascending orderApartments
apt.
Price per m²
475 
483 
541 
562