emooki
HomePrice mapTransactions
🇬🇧 English🇫🇷 Français🇩🇪 Deutsch🇪🇸 Español🇮🇹 Italiano

Real estate price map


Real estate price map in the municipality of Saint-Alban-de-Roche, choose a section to see transactions by parcel.

Isère (38)

Saint-Alban-de-Roche - Real estate price m²

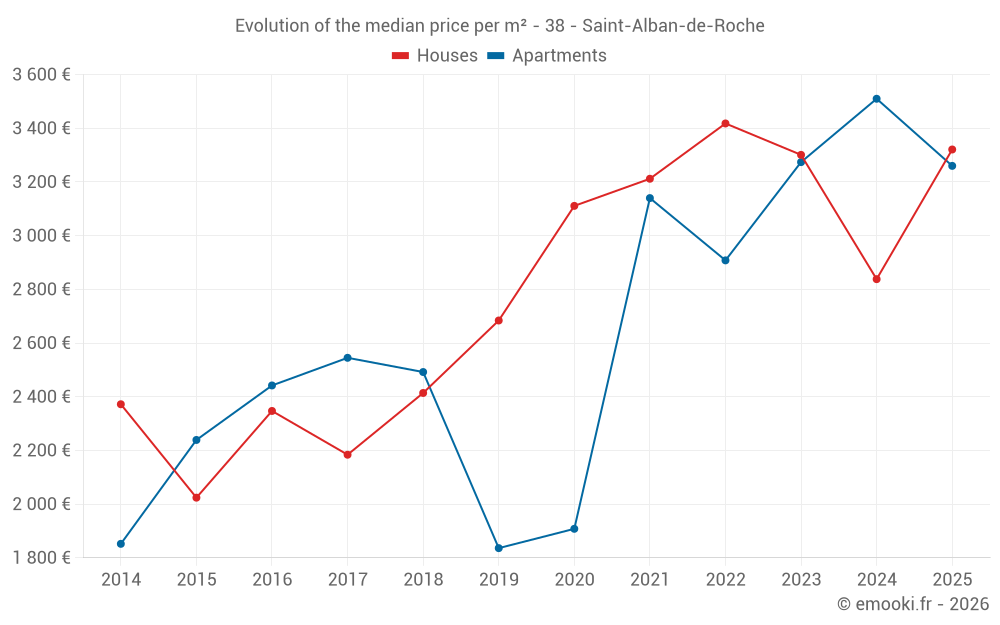
Median price of real estate
in the municipality of Saint-Alban-de-Roche

HousesHouses
3 273  /m²
1-23-45-67-89-10
Reliability 8/10
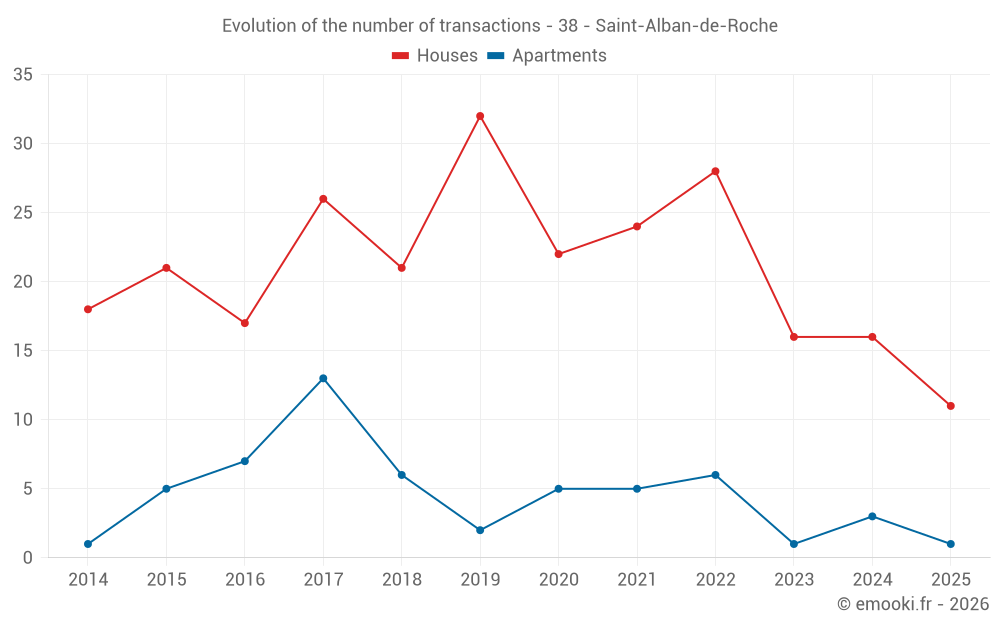
Median price on the 18 transactions of the last 12 months.
from 2 478 to
3 699  /m²
60% of transactions from the 2nd to the 8th deciles.
ApartmentsApartments
3 409  /m²
1-23-45-67-89-10
Reliability 5/10
Median price on the 13 transactions of the last 48 months.
from 2 230 to
3 571  /m²
60% of transactions from the 2nd to the 8th deciles.
DwellingsDwellings
3 321  /m²
1-23-45-67-89-10
Reliability 8/10
Median price on the 21 transactions of the last 12 months.
from 2 527 to
3 675  /m²
60% of transactions from the 2nd to the 8th deciles.
HousesEvolution of the price per m² of houses since...
1 year
+17%
2 years
+0.6%
3 years
-2.8%
4 years
+3.4%
5 years
+6.8%
6 years
+24%
7 years
+38%
8 years
+52%
9 years
+41%
10 years
+64%
11 years
+40%
The price per m² of houses has decreased by 2.8% since 3 years, but it has increased by 64% in 10 years.

Yearly evolution

Evolution of the median price per m²

Evolution of the median price per m² - 38 - Saint-Alban-de-Roche

Evolution of the number of transactions

Warning, last year incomplete. Projections made based on the proportions between semesters of the previous year at the departmental/national level and by type of property.

Evolution of the number of transactions - 38 - Saint-Alban-de-Roche

Yearly data

Descending order
Year
Houses
house
transactions
Houses
house
Price per m²
Apartments
apt.
transactions
Apartments
apt.
Price per m²
2025
11
3 321 
1
3 260 
2024
16
2 838 
3
3 510 
2023
16
3 301 
1
3 274 
2022
28
3 418 
6
2 908 
2021
24
3 212 
5
3 140 
2020
22
3 111 
5
1 908 
2019
32
2 684 
2
1 836 
2018
21
2 414 
6
2 492 
2017
26
2 184 
13
2 545 
2016
17
2 347 
7
2 442 
2015
21
2 024 
5
2 239 
2014
18
2 372 
1
1 852 

Analysis

Structure of prices per m²

Values of price percentiles per m² over the periods used for the estimated price of each type of property.

Structure of transaction amounts

Values of transaction amounts percentiles over the periods used for the estimated price of each type of property.

Transaction amounts and prices per m² by percentile

Ascending order
Percentile
Houses
house
Price per m²
Houses
house
Transaction amount
Apartments
apt.
Price per m²
Apartments
apt.
Transaction amount
10th percentile
1 889 
138 K
1 994 
176 K
20th percentile
2 478 
208 K
2 230 
186 K
30th percentile
2 765 
228 K
2 884 
202 K
40th percentile
3 056 
296 K
3 271 
220 K
50th percentile
3 273 
312 K
3 409 
225 K
60th percentile
3 383 
322 K
3 499 
231 K
70th percentile
3 550 
368 K
3 509 
237 K
80th percentile
3 699 
422 K
3 571 
238 K
90th percentile
3 911 
465 K
3 748 
250 K

National and departmental comparison

Evolution of the median price per m² of houses

Evolution of the median price per m² of apartments

Quarterly evolution

Evolution of the median price per m²

Evolution of the number of transactions

Quarterly data

Descending order
Quarter
Houses
house
transactions
Houses
house
Price per m²
Apartments
apt.
transactions
Apartments
apt.
Price per m²
2025 Q2
2
3 558 
0
--- 
2025 Q1
9
3 225 
1
3 260 
2024 Q4
6
2 992 
2
3 510 
2024 Q3
1
2 755 
0
--- 
2024 Q2
4
2 952 
1
4 108 
2024 Q1
5
2 526 
0
--- 
2023 Q4
2
4 024 
0
--- 
2023 Q3
8
3 552 
1
3 274 
2023 Q2
2
2 982 
0
--- 
2023 Q1
4
2 639 
0
--- 
2022 Q4
12
3 552 
2
1 964 
2022 Q3
5
3 416 
0
--- 
2022 Q2
5
3 419 
2
2 833 
2022 Q1
6
3 328 
2
3 697 
2021 Q4
3
4 160 
0
--- 
2021 Q3
12
3 145 
2
2 680 
2021 Q2
8
3 412 
0
--- 
2021 Q1
1
2 011 
3
3 140 
2020 Q4
5
3 602 
1
1 678 
2020 Q3
6
3 389 
1
2 483 
2020 Q2
7
3 055 
2
1 835 
2020 Q1
4
2 844 
1
1 908 
2019 Q4
11
2 667 
1
2 640 
2019 Q3
9
2 843 
0
--- 
2019 Q2
7
2 738 
1
1 032 
2019 Q1
5
1 987 
0
--- 
2018 Q4
8
2 352 
1
2 494 
2018 Q3
3
1 674 
0
--- 
2018 Q2
6
2 094 
2
2 088 
2018 Q1
4
2 605 
3
2 578 
2017 Q4
6
2 142 
1
2 002 
2017 Q3
6
2 281 
7
2 545 
2017 Q2
8
2 464 
3
3 000 
2017 Q1
6
2 006 
2
2 290 
2016 Q4
5
2 243 
0
--- 
2016 Q3
5
2 753 
1
2 442 
2016 Q2
2
2 786 
4
2 612 
2016 Q1
5
2 127 
2
1 946 
2015 Q4
6
2 124 
3
2 239 
2015 Q3
6
1 774 
1
716 
2015 Q2
6
1 985 
0
--- 
2015 Q1
3
1 949 
1
2 815 
2014 Q4
6
2 372 
0
--- 
2014 Q3
5
2 272 
1
1 852 
2014 Q2
4
2 352 
0
--- 
2014 Q1
3
2 913 
0
--- 

Overview of the latest real estate transactions

The following list is an anonymized overview of the latest transactions. For more details and to find all transactions, please use the map to view transactions by plot or the transaction search page for a search by criteria.

2025-05-07
338 750 
3 321  /m²(102 m²)
Sale
Houses
House
6 rooms
102 m2
Land
375 m2
-Sols
2025-04-09
315 000 
3 795  /m²(83 m²)
Sale
Houses
House
5 rooms
83 m2
Land
303 m2
-Sols
Land
201 m2
-Sols
Land
238 m2
-Sols
2025-03-31
4 280 
30  /m²(141 m²)
Sale
Houses
House
5 rooms
141 m2
Land
1169 m2
-Sols
2025-03-20
140 000 
1 750  /m²(80 m²)
Sale
Houses
House
2 rooms
80 m2
3 outbuildings
Land
210 m2
-Sols
Land
428 m2
-Jardins
2025-03-18
305 000 
3 675  /m²(83 m²)
Sale
Houses
House
5 rooms
83 m2
Land
252 m2
-Sols
Land
125 m2
-Sols
2025-02-26
2 049 
Sale
Land
1600 m2
-Prés
Land
4253 m2
-Terres
2025-02-21
512 530 
3 106  /m²(165 m²)
Sale
Houses
House
5 rooms
165 m2
1 outbuilding
Land
1122 m2
-Sols
Land
80 m2
-Sols
2025-02-21
258 000 
3 225  /m²(80 m²)
Sale
Houses
House
4 rooms
80 m2
1 outbuilding
Land
578 m2
-Sols
Land
63 m2
-Vignes
2025-02-21
163 000 
3 260  /m²(50 m²)
Sale
Apartments
Apartment
2 rooms
50 m2
1 outbuilding
2025-02-20
445 000 
3 560  /m²(125 m²)
Sale
Houses
House
5 rooms
125 m2
1 outbuilding
Land
567 m2
-Sols
Land
158 m2
-Landes
2025-02-06
371 500 
2 858  /m²(130 m²)
Sale
Houses
House
5 rooms
130 m2
2 outbuildings
Land
165 m2
-Sols
2025-02-04
234 000 
Sale
Land
765 m2
-Terrains à bâtir
Land
247 m2
-Sols
2025-01-10
530 000 
4 417  /m²(120 m²)
Sale
Houses
House
4 rooms
120 m2
Land
665 m2
-Sols
Land
492 m2
-Jardins
Land
1260 m2
-Prés
2025-01-09
309 500 
3 364  /m²(92 m²)
Sale
Houses
House
3 rooms
92 m2
Land
157 m2
-Sols
Land
29 m2
-Sols
Land
13 m2
-Jardins
2024-12-30
224 900 
2 527  /m²(89 m²)
Sale
Land
59 m2
-Sols
Land
115 m2
-Sols
1 outbuilding
Land
21 m2
-Sols
1 outbuilding
Land
33 m2
-Sols
Houses
House
4 rooms
89 m2
Land
97 m2
-Sols
2024-12-20
418 200 
4 182  /m²(100 m²)
Sale
Houses
House
4 rooms
100 m2
1 outbuilding
Land
550 m2
-Sols
Land
782 m2
-Terres
Land
8 m2
-Terres
2024-12-13
222 900 
3 715  /m²(60 m²)
Sale
Houses
House
3 rooms
60 m2
Land
32 m2
-Sols
Land
28 m2
-Sols
2024-11-28
132 500 
1 949  /m²(68 m²)
Sale
Houses
House
3 rooms
68 m2
Land
246 m2
-Sols
Land
112 m2
-Sols
Land
74 m2
-Prés
Land
219 m2
-Prés
Land
1500 m2
-Prés
2024-11-26
3 000 
Sale
Land
86 m2
-Taillis simples
Land
1102 m2
-Terres
Land
1239 m2
-Prés
Land
781 m2
-Prés
Land
720 m2
-Taillis simples
Land
264 m2
-Taillis simples
2024-11-12
207 040 
3 509  /m²(59 m²)
Sale
Apartments
Apartment
3 rooms
59 m2
2 outbuildings
513 transactions listed in the municipality

Isère (38)

Most expensive cities

City
name
Descending orderHouses
house
Price per m²
8 262 
4 917 
4 777 
4 663 
4 610 
4 575 
4 506 
City
name
Descending orderApartments
apt.
Price per m²
7 647 
6 370 
5 636 
4 866 
4 524 
4 492 
4 249 
4 234 
3 958 

Least expensive cities

City
name
Ascending orderHouses
house
Price per m²
502 
722 
975 
1 133 
1 198 
1 237 
City
name
Ascending orderApartments
apt.
Price per m²
475 
483 
541 
562