emooki
HomePrice mapTransactions
🇬🇧 English🇫🇷 Français🇩🇪 Deutsch🇪🇸 Español🇮🇹 Italiano

Real estate price map


Real estate price map in the municipality of Auberives-sur-Varèze.

Isère (38)
Auberives-sur-Varèze

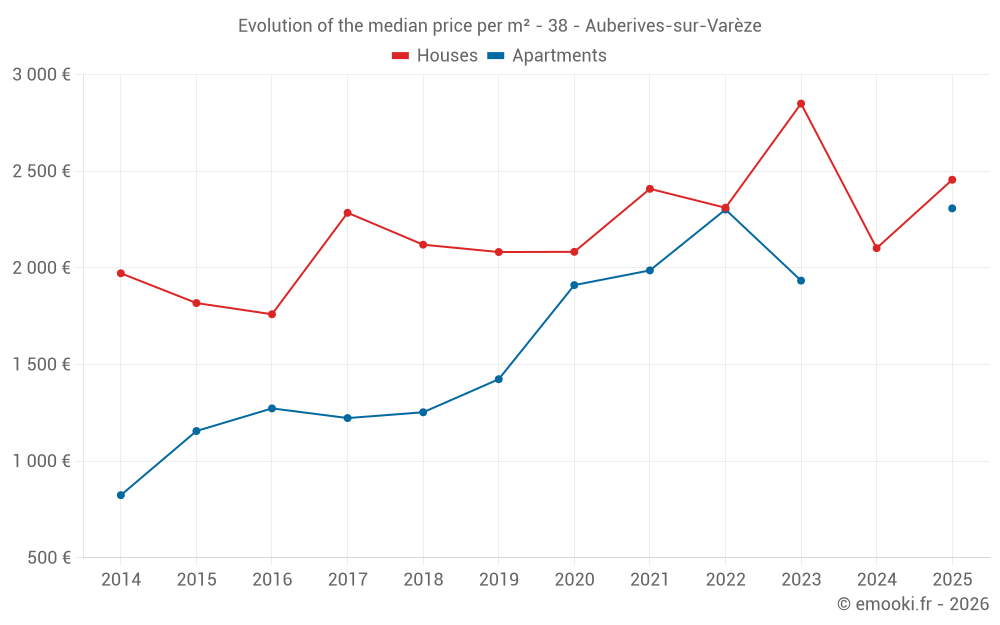
Median price of real estate
in the municipality of Auberives-sur-Varèze

HousesHouses
2 452  /m²
1-23-45-67-89-10
Reliability 7/10
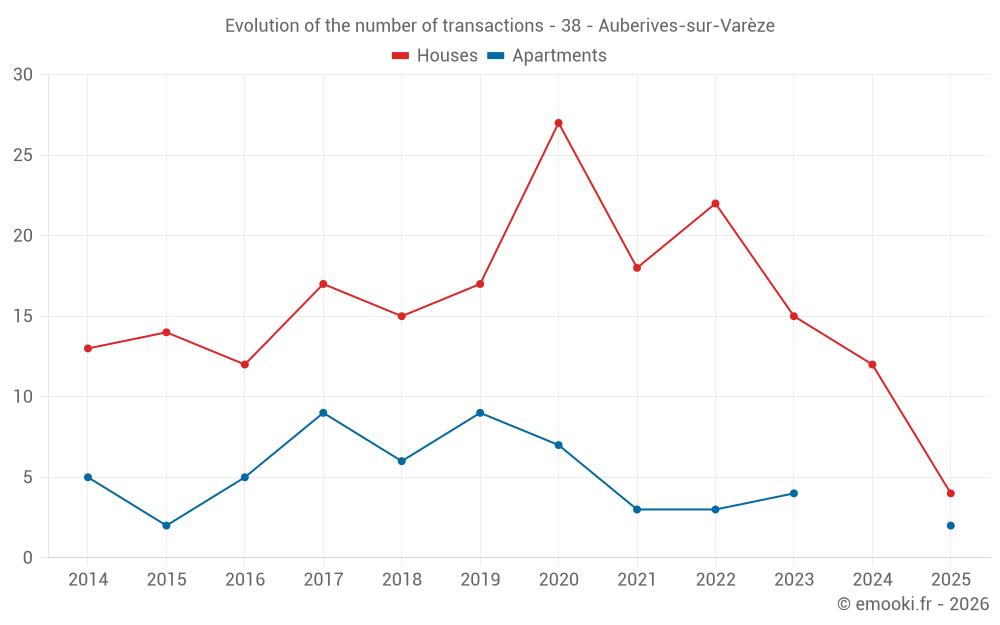
Median price on the 22 transactions of the last 24 months.
from 1 182 to
2 767  /m²
60% of transactions from the 2nd to the 8th deciles.
ApartmentsApartments
2 071  /m²
1-23-45-67-89-10
Reliability 5/10
Median price on the 11 transactions of the last 48 months.
from 1 825 to
2 302  /m²
60% of transactions from the 2nd to the 8th deciles.
DwellingsDwellings
2 372  /m²
1-23-45-67-89-10
Reliability 7/10
Median price on the 26 transactions of the last 24 months.
from 1 275 to
2 686  /m²
60% of transactions from the 2nd to the 8th deciles.
HousesEvolution of the price per m² of houses since...
1 year
--
2 years
--
3 years
--
4 years
--
5 years
--
6 years
--
7 years
--
8 years
--
9 years
--
10 years
--
11 years
--
ApartmentsEvolution of the price per m² of apartments since...
1 year
--
2 years
--
3 years
--
4 years
--
5 years
--
6 years
--
7 years
--
8 years
--
9 years
--
10 years
--
11 years
--

Yearly evolution

Evolution of the median price per m²

Evolution of the number of transactions

Warning, last year incomplete. Projections made based on the proportions between semesters of the previous year at the departmental/national level and by type of property.

Yearly data

Descending order
Year
Houses
house
transactions
Houses
house
Price per m²
Apartments
apt.
transactions
Apartments
apt.
Price per m²
2025
4
2 456 
2
2 308 
2024
12
2 102 
0
--- 
2023
15
2 850 
4
1 934 
2022
22
2 311 
3
2 302 
2021
18
2 409 
3
1 987 
2020
27
2 083 
7
1 911 
2019
17
2 082 
9
1 424 
2018
15
2 120 
6
1 253 
2017
17
2 285 
9
1 223 
2016
12
1 760 
5
1 273 
2015
14
1 818 
2
1 156 
2014
13
1 972 
5
824 

Analysis

Structure of prices per m²

Values of price percentiles per m² over the periods used for the estimated price of each type of property.

Structure of transaction amounts

Values of transaction amounts percentiles over the periods used for the estimated price of each type of property.

Transaction amounts and prices per m² by percentile

Ascending order
Percentile
Houses
house
Price per m²
Houses
house
Transaction amount
Apartments
apt.
Price per m²
Apartments
apt.
Transaction amount
10th percentile
789 
85 500 
1 594 
110 K
20th percentile
1 182 
132 K
1 825 
110 K
30th percentile
1 958 
200 K
1 900 
114 K
40th percentile
2 192 
222 K
1 930 
119 K
50th percentile
2 452 
231 K
2 071 
125 K
60th percentile
2 488 
253 K
2 273 
145 K
70th percentile
2 552 
264 K
2 274 
159 K
80th percentile
2 767 
297 K
2 302 
159 K
90th percentile
3 107 
331 K
2 380 
169 K

National and departmental comparison

Evolution of the median price per m² of houses

Evolution of the median price per m² of apartments

Quarterly evolution

Evolution of the median price per m²

Evolution of the number of transactions

Quarterly data

Descending order
Quarter
Houses
house
transactions
Houses
house
Price per m²
Apartments
apt.
transactions
Apartments
apt.
Price per m²
2025 Q2
1
2 570 
1
2 686 
2025 Q1
3
2 444 
1
1 930 
2024 Q4
1
3 883 
0
--- 
2024 Q3
5
2 301 
0
--- 
2024 Q2
2
2 012 
0
--- 
2024 Q1
4
1 621 
0
--- 
2023 Q4
2
2 706 
2
1 934 
2023 Q3
4
2 766 
0
--- 
2023 Q2
2
2 359 
1
2 273 
2023 Q1
7
3 010 
1
938 
2022 Q4
5
1 872 
0
--- 
2022 Q3
5
2 455 
1
2 380 
2022 Q2
7
2 241 
1
1 825 
2022 Q1
5
2 028 
1
2 302 
2021 Q4
3
1 515 
2
1 986 
2021 Q3
4
1 488 
0
--- 
2021 Q2
10
2 680 
1
1 987 
2021 Q1
1
2 247 
0
--- 
2020 Q4
8
1 898 
3
1 335 
2020 Q3
8
2 220 
2
1 420 
2020 Q2
8
2 274 
2
1 926 
2020 Q1
3
1 947 
0
--- 
2019 Q4
4
2 046 
1
919 
2019 Q3
6
1 930 
2
1 410 
2019 Q2
4
2 548 
1
1 887 
2019 Q1
3
2 278 
5
1 424 
2018 Q4
3
2 014 
2
1 322 
2018 Q3
6
2 086 
4
1 214 
2018 Q2
3
2 120 
0
--- 
2018 Q1
3
2 156 
0
--- 
2017 Q4
4
1 932 
1
1 138 
2017 Q3
8
2 312 
3
1 223 
2017 Q2
3
2 435 
4
1 172 
2017 Q1
2
2 086 
1
1 418 
2016 Q4
4
1 608 
2
1 210 
2016 Q3
6
1 968 
0
--- 
2016 Q2
1
1 760 
3
1 329 
2016 Q1
1
1 411 
0
--- 
2015 Q4
4
1 878 
1
1 236 
2015 Q3
4
2 040 
0
--- 
2015 Q2
2
1 720 
0
--- 
2015 Q1
4
1 591 
1
1 076 
2014 Q4
3
2 642 
2
1 012 
2014 Q3
3
1 973 
2
1 156 
2014 Q2
1
1 959 
1
794 
2014 Q1
6
1 903 
0
--- 

Isère (38)

Most expensive cities

City
name
Descending orderHouses
house
Price per m²
8 262 
4 917 
4 777 
4 663 
4 610 
4 575 
4 506 
City
name
Descending orderApartments
apt.
Price per m²
7 647 
6 370 
5 636 
4 866 
4 524 
4 492 
4 249 
4 234 
3 958 

Least expensive cities

City
name
Ascending orderHouses
house
Price per m²
502 
722 
975 
1 133 
1 198 
1 237 
City
name
Ascending orderApartments
apt.
Price per m²
475 
483 
541 
562