emooki
HomePrice mapTransactions
🇬🇧 English🇫🇷 Français🇩🇪 Deutsch🇪🇸 Español🇮🇹 Italiano

Real estate price map


Real estate price map in the municipality of Neuillé-Pont-Pierre, choose a section to see transactions by parcel.

Indre-et-Loire (37)

Neuillé-Pont-Pierre - Real estate price m²

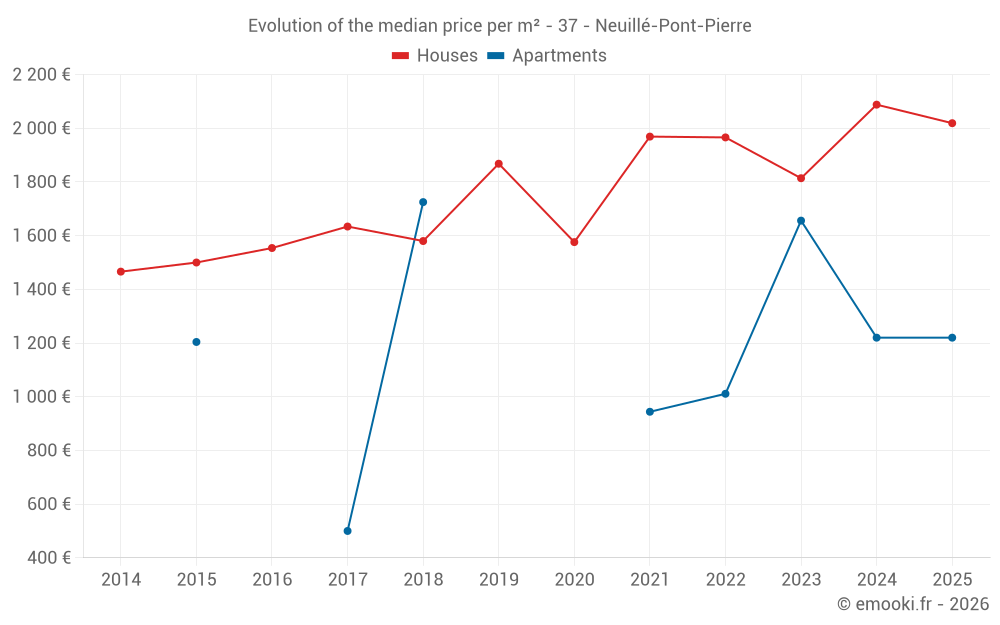
Median price of real estate
in the municipality of Neuillé-Pont-Pierre

HousesHouses
2 087  /m²
1-23-45-67-89-10
Reliability 7/10
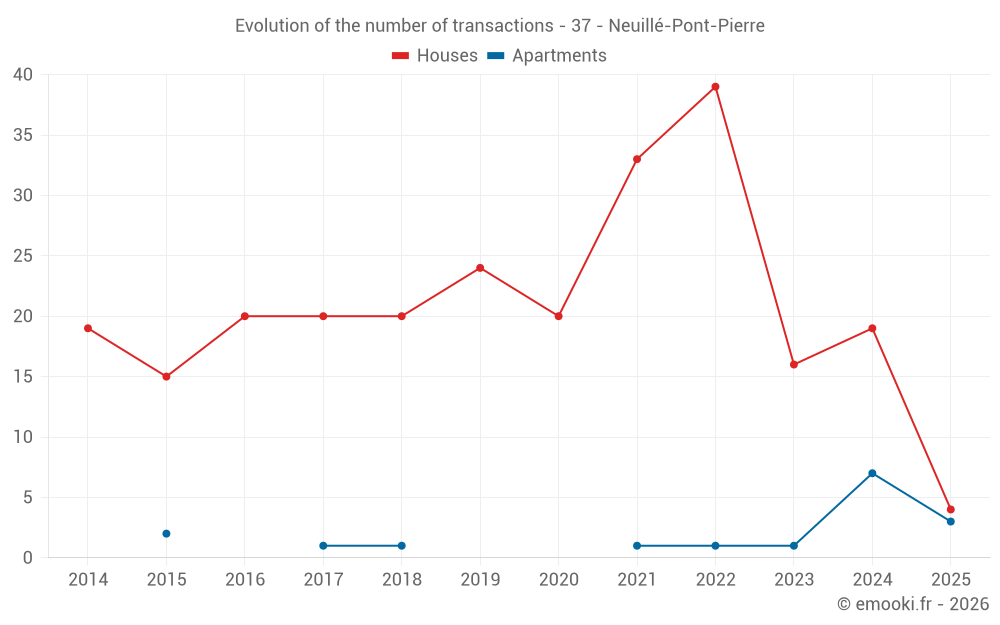
Median price on the 28 transactions of the last 24 months.
from 1 143 to
2 660  /m²
60% of transactions from the 2nd to the 8th deciles.
ApartmentsApartments
1 220  /m²
1-23-45-67-89-10
Reliability 6/10
Median price on the 12 transactions of the last 36 months.
from 1 220 to
1 440  /m²
60% of transactions from the 2nd to the 8th deciles.
DwellingsDwellings
1 875  /m²
1-23-45-67-89-10
Reliability 8/10
Median price on the 23 transactions of the last 12 months.
from 1 220 to
2 463  /m²
60% of transactions from the 2nd to the 8th deciles.
HousesEvolution of the price per m² of houses since...
1 year
-3.3%
2 years
+11%
3 years
+2.7%
4 years
+2.5%
5 years
+28%
6 years
+8.1%
7 years
+28%
8 years
+24%
9 years
+30%
10 years
+35%
11 years
+38%
The price per m² of houses has decreased by 3.3% since 1 year, but it has increased by 38% in 11 years.

Yearly evolution

Evolution of the median price per m²

Evolution of the median price per m² - 37 - Neuillé-Pont-Pierre

Evolution of the number of transactions

Warning, last year incomplete. Projections made based on the proportions between semesters of the previous year at the departmental/national level and by type of property.

Evolution of the number of transactions - 37 - Neuillé-Pont-Pierre

Yearly data

Descending order
Year
Houses
house
transactions
Houses
house
Price per m²
Apartments
apt.
transactions
Apartments
apt.
Price per m²
2025
4
2 019 
3
1 220 
2024
19
2 088 
7
1 220 
2023
16
1 814 
1
1 656 
2022
39
1 966 
1
1 011 
2021
33
1 969 
1
944 
2020
20
1 576 
0
--- 
2019
24
1 868 
0
--- 
2018
20
1 580 
1
1 725 
2017
20
1 634 
1
500 
2016
20
1 554 
0
--- 
2015
15
1 500 
2
1 204 
2014
19
1 466 
0
--- 

Analysis

Structure of prices per m²

Values of price percentiles per m² over the periods used for the estimated price of each type of property.

Structure of transaction amounts

Values of transaction amounts percentiles over the periods used for the estimated price of each type of property.

Transaction amounts and prices per m² by percentile

Ascending order
Percentile
Houses
house
Price per m²
Houses
house
Transaction amount
Apartments
apt.
Price per m²
Apartments
apt.
Transaction amount
10th percentile
850 
124 K
1 220 
76 860 
20th percentile
1 143 
137 K
1 220 
76 860 
30th percentile
1 691 
143 K
1 220 
81 252 
40th percentile
2 043 
181 K
1 220 
91 500 
50th percentile
2 087 
200 K
1 220 
91 500 
60th percentile
2 169 
224 K
1 220 
91 500 
70th percentile
2 601 
244 K
1 220 
115 K
80th percentile
2 660 
261 K
1 440 
134 K
90th percentile
2 870 
270 K
1 607 
155 K

National and departmental comparison

Evolution of the median price per m² of houses

Evolution of the median price per m² of apartments

Quarterly evolution

Evolution of the median price per m²

Evolution of the number of transactions

Quarterly data

Descending order
Quarter
Houses
house
transactions
Houses
house
Price per m²
Apartments
apt.
transactions
Apartments
apt.
Price per m²
2025 Q2
1
2 151 
1
1 220 
2025 Q1
3
1 979 
2
1 358 
2024 Q4
5
2 634 
3
1 220 
2024 Q3
6
1 980 
2
1 220 
2024 Q2
5
2 131 
1
1 220 
2024 Q1
3
893 
1
1 220 
2023 Q4
3
2 684 
0
--- 
2023 Q3
2
1 707 
1
1 656 
2023 Q2
8
1 814 
0
--- 
2023 Q1
3
1 510 
0
--- 
2022 Q4
8
1 773 
1
1 011 
2022 Q3
15
1 966 
0
--- 
2022 Q2
6
2 359 
0
--- 
2022 Q1
10
1 848 
0
--- 
2021 Q4
6
2 252 
0
--- 
2021 Q3
11
1 679 
1
944 
2021 Q2
12
1 974 
0
--- 
2021 Q1
4
1 691 
0
--- 
2020 Q4
6
1 482 
0
--- 
2020 Q3
7
1 964 
0
--- 
2020 Q2
5
1 171 
0
--- 
2020 Q1
2
2 038 
0
--- 
2019 Q4
6
1 958 
0
--- 
2019 Q3
7
1 848 
0
--- 
2019 Q2
5
2 135 
0
--- 
2019 Q1
6
1 494 
0
--- 
2018 Q4
7
1 579 
1
1 725 
2018 Q3
2
1 683 
0
--- 
2018 Q2
6
1 942 
0
--- 
2018 Q1
5
1 517 
0
--- 
2017 Q4
6
1 660 
0
--- 
2017 Q3
6
1 430 
0
--- 
2017 Q2
5
1 627 
1
500 
2017 Q1
3
1 702 
0
--- 
2016 Q4
6
1 947 
0
--- 
2016 Q3
7
1 400 
0
--- 
2016 Q2
6
1 496 
0
--- 
2016 Q1
1
588 
0
--- 
2015 Q4
5
1 743 
1
1 816 
2015 Q3
3
952 
0
--- 
2015 Q2
4
1 226 
1
592 
2015 Q1
3
1 333 
0
--- 
2014 Q4
8
1 502 
0
--- 
2014 Q3
4
1 474 
0
--- 
2014 Q2
2
1 677 
0
--- 
2014 Q1
5
1 242 
0
--- 

Overview of the latest real estate transactions

The following list is an anonymized overview of the latest transactions. For more details and to find all transactions, please use the map to view transactions by plot or the transaction search page for a search by criteria.

2025-06-10
305 000 
401  /m²(760 m²)
Sale
Commercial property
760 m2
Land
2313 m2
-Sols
2025-05-20
91 500 
1 220  /m²(75 m²)
Sale
Apartments
Apartment
4 rooms
75 m2
1 outbuilding
2025-05-12
1 
Sale
Land
414 m2
-Sols
Land
456 m2
-Terrains à bâtir
Land
400 m2
-Terrains à bâtir
Land
43 m2
-Sols
Land
20 m2
-Sols
Land
151 m2
-Sols
Land
968 m2
-Sols
Land
1664 m2
-Sols
Land
1 m2
-Sols
Land
574 m2
-Sols
Land
1 m2
-Sols
Land
181 m2
-Sols
2025-04-30
45 850 
transaction.nature.Vente terrain à bâtir
Land
470 m2
-Terrains à bâtir
2025-04-29
157 000 
2 151  /m²(73 m²)
Sale
Houses
House
4 rooms
73 m2
Land
396 m2
-Sols
2025-04-17
80 000 
Sale
Land
1650 m2
-Prés
2025-03-28
97 500 
Sale
Land
3560 m2
-Prés
Land
3255 m2
-Prés
Land
2625 m2
-Prés
Land
57845 m2
-Terres
Land
13347 m2
-Terres
Land
13346 m2
-Terres
Land
13819 m2
-Prés
Land
108253 m2
-Terres
Land
1768 m2
-Terres
Land
3729 m2
-Terres
Land
4126 m2
-Terres
Land
16260 m2
-Terres
Land
1430 m2
-Terres
2025-03-28
5 765 
Sale
Land
2446 m2
-Terres
Land
901 m2
-Terres
Land
11064 m2
-Terres
2025-03-20
16 950 
Sale
Land
1394 m2
-Vergers
Land
47995 m2
-Taillis simples
Land
362 m2
-Taillis simples
2025-03-14
1 
Sale
2025-03-12
199 400 
Sale
2025-03-06
197 900 
1 979  /m²(100 m²)
Sale
Houses
House
4 rooms
100 m2
Land
712 m2
-Sols
2025-03-04
5 000 
Sale
Land
168 m2
-Sols
2025-02-28
223 000 
1 593  /m²(140 m²)
Sale
Land
393 m2
-Sols
Houses
House
6 rooms
140 m2
6 outbuildings
Land
182 m2
-Sols
Land
243 m2
-Jardins
/Jardin potager
2025-02-05
63 440 
1 220  /m²(52 m²)
Sale
Apartments
Apartment
2 rooms
52 m2
1 outbuilding
2025-02-03
110 000 
Sale
Land
42 m2
-Sols
Land
432 m2
-Terrains à bâtir
Land
13 m2
-Sols
Land
95 m2
-Terrains à bâtir
Land
482 m2
-Terrains à bâtir
Land
27 m2
-Sols
2025-01-27
125 600 
1 495  /m²(84 m²)
Sale
Apartments
Apartment
5 rooms
84 m2
1 outbuilding
2025-01-07
140 000 
2 059  /m²(68 m²)
Sale
Houses
House
4 rooms
68 m2
Land
394 m2
-Sols
2024-12-27
70 000 
Sale
1 outbuilding
Land
14561 m2
-Terrains d'agrément
/Parc
Land
7481 m2
-Eaux
/ETANG
Land
842 m2
-Eaux
/ETANG
Land
11056 m2
-Terrains d'agrément
/Parc
Land
13824 m2
-Eaux
/ETANG
Land
3480 m2
-Prés
Land
120 m2
-Sols
Land
183 m2
-Terres
2024-12-16
1 
Sale
Land
189 m2
-Terrains à bâtir
Land
1177 m2
-Terrains à bâtir
Land
1107 m2
-Terrains à bâtir
Land
1342 m2
-Terrains à bâtir
Land
1262 m2
-Terrains à bâtir
Land
1515 m2
-Terrains à bâtir
Land
668 m2
-Sols
Land
66 m2
-Sols
594 transactions listed in the municipality

Indre-et-Loire (37)

Most expensive cities

City
name
Descending orderHouses
house
Price per m²
3 030 
2 860 
2 826 
2 791 
2 749 
2 730 
2 679 
City
name
Descending orderApartments
apt.
Price per m²
7 176 
2 953 
2 839 
2 791 
2 788 
2 758 

Least expensive cities

City
name
Ascending orderHouses
house
Price per m²
694 
729 
766 
802 
818 
845 
City
name
Ascending orderApartments
apt.
Price per m²
98 
209 
299 
452