emooki
HomePrice mapTransactions
🇬🇧 English🇫🇷 Français🇩🇪 Deutsch🇪🇸 Español🇮🇹 Italiano

Real estate price map


Real estate price map in the municipality of La Membrolle-sur-Choisille, choose a section to see transactions by parcel.

Indre-et-Loire (37)

La Membrolle-sur-Choisille - Real estate price m²

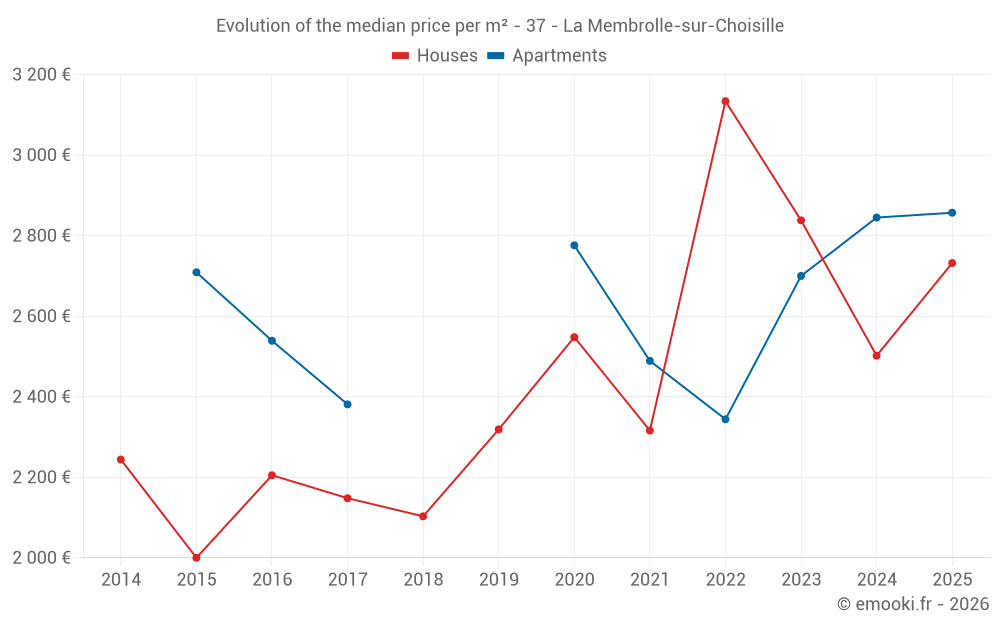
Median price of real estate
in the municipality of La Membrolle-sur-Choisille

HousesHouses
2 596  /m²
1-23-45-67-89-10
Reliability 8/10
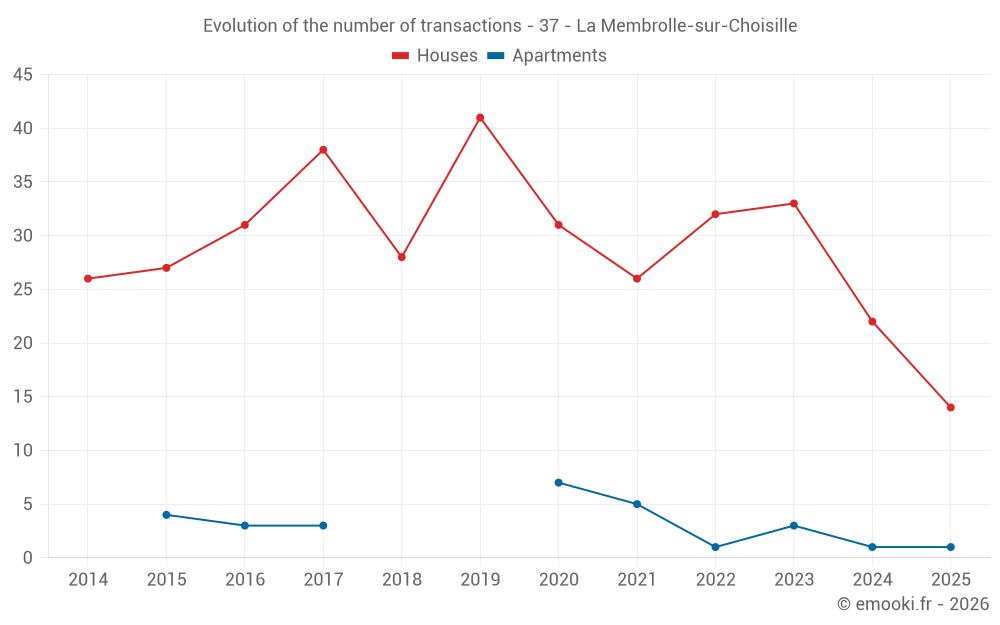
Median price on the 26 transactions of the last 12 months.
from 1 452 to
2 850  /m²
60% of transactions from the 2nd to the 8th deciles.
ApartmentsApartments
2 678  /m²
1-23-45-67-89-10
Reliability 4/10
Median price on the 13 transactions of the last 60 months.
from 2 402 to
2 849  /m²
60% of transactions from the 2nd to the 8th deciles.
DwellingsDwellings
2 618  /m²
1-23-45-67-89-10
Reliability 8/10
Median price on the 28 transactions of the last 12 months.
from 1 628 to
2 854  /m²
60% of transactions from the 2nd to the 8th deciles.
HousesEvolution of the price per m² of houses since...
1 year
+9.2%
2 years
-3.7%
3 years
-13%
4 years
+18%
5 years
+7.2%
6 years
+18%
7 years
+30%
8 years
+27%
9 years
+24%
10 years
+37%
11 years
+22%
The price per m² of houses has decreased by 13% since 3 years, but it has increased by 37% in 10 years.

Yearly evolution

Evolution of the median price per m²

Evolution of the median price per m² - 37 - La Membrolle-sur-Choisille

Evolution of the number of transactions

Warning, last year incomplete. Projections made based on the proportions between semesters of the previous year at the departmental/national level and by type of property.

Evolution of the number of transactions - 37 - La Membrolle-sur-Choisille

Yearly data

Descending order
Year
Houses
house
transactions
Houses
house
Price per m²
Apartments
apt.
transactions
Apartments
apt.
Price per m²
2025
14
2 732 
1
2 857 
2024
22
2 502 
1
2 845 
2023
33
2 838 
3
2 700 
2022
32
3 134 
1
2 344 
2021
26
2 316 
5
2 489 
2020
31
2 548 
7
2 776 
2019
41
2 319 
0
--- 
2018
28
2 103 
0
--- 
2017
38
2 148 
3
2 381 
2016
31
2 205 
3
2 539 
2015
27
2 000 
4
2 709 
2014
26
2 244 
0
--- 

Analysis

Structure of prices per m²

Values of price percentiles per m² over the periods used for the estimated price of each type of property.

Structure of transaction amounts

Values of transaction amounts percentiles over the periods used for the estimated price of each type of property.

Transaction amounts and prices per m² by percentile

Ascending order
Percentile
Houses
house
Price per m²
Houses
house
Transaction amount
Apartments
apt.
Price per m²
Apartments
apt.
Transaction amount
10th percentile
1 164 
120 K
2 343 
117 K
20th percentile
1 452 
172 K
2 402 
142 K
30th percentile
2 296 
182 K
2 500 
155 K
40th percentile
2 433 
203 K
2 556 
158 K
50th percentile
2 596 
227 K
2 678 
161 K
60th percentile
2 696 
253 K
2 715 
166 K
70th percentile
2 756 
273 K
2 804 
173 K
80th percentile
2 850 
310 K
2 849 
190 K
90th percentile
3 090 
343 K
2 856 
199 K

National and departmental comparison

Evolution of the median price per m² of houses

Evolution of the median price per m² of apartments

Quarterly evolution

Evolution of the median price per m²

Evolution of the number of transactions

Quarterly data

Descending order
Quarter
Houses
house
transactions
Houses
house
Price per m²
Apartments
apt.
transactions
Apartments
apt.
Price per m²
2025 Q2
4
2 886 
0
--- 
2025 Q1
10
2 663 
1
2 857 
2024 Q4
7
2 400 
1
2 845 
2024 Q3
5
1 452 
0
--- 
2024 Q2
7
2 661 
0
--- 
2024 Q1
3
1 875 
0
--- 
2023 Q4
7
2 632 
1
2 678 
2023 Q3
15
2 838 
1
3 017 
2023 Q2
4
2 828 
0
--- 
2023 Q1
7
2 944 
1
2 700 
2022 Q4
8
2 866 
1
2 344 
2022 Q3
8
3 297 
0
--- 
2022 Q2
10
3 246 
0
--- 
2022 Q1
6
2 714 
0
--- 
2021 Q4
8
2 649 
0
--- 
2021 Q3
11
2 280 
2
2 670 
2021 Q2
3
1 935 
3
2 343 
2021 Q1
4
2 074 
0
--- 
2020 Q4
9
2 642 
0
--- 
2020 Q3
9
2 479 
2
2 672 
2020 Q2
7
2 584 
2
1 522 
2020 Q1
6
2 526 
3
2 917 
2019 Q4
12
2 385 
0
--- 
2019 Q3
11
2 378 
0
--- 
2019 Q2
10
2 355 
0
--- 
2019 Q1
8
2 228 
0
--- 
2018 Q4
6
2 050 
0
--- 
2018 Q3
7
2 283 
0
--- 
2018 Q2
6
1 786 
0
--- 
2018 Q1
9
1 750 
0
--- 
2017 Q4
8
2 126 
0
--- 
2017 Q3
12
2 372 
0
--- 
2017 Q2
11
1 957 
2
2 377 
2017 Q1
7
2 105 
1
2 923 
2016 Q4
6
2 093 
2
2 224 
2016 Q3
8
2 060 
0
--- 
2016 Q2
10
2 196 
1
3 308 
2016 Q1
7
2 421 
0
--- 
2015 Q4
8
2 046 
2
2 662 
2015 Q3
6
1 968 
1
3 128 
2015 Q2
3
2 124 
0
--- 
2015 Q1
10
2 130 
1
2 593 
2014 Q4
9
2 133 
0
--- 
2014 Q3
6
2 840 
0
--- 
2014 Q2
7
2 092 
0
--- 
2014 Q1
4
2 248 
0
--- 

Overview of the latest real estate transactions

The following list is an anonymized overview of the latest transactions. For more details and to find all transactions, please use the map to view transactions by plot or the transaction search page for a search by criteria.

2025-06-10
305 000 
2 723  /m²(112 m²)
Sale
Houses
House
5 rooms
112 m2
Land
763 m2
-Sols
2025-06-05
132 000 
971  /m²(136 m²)
Sale
Houses
House
6 rooms
87 m2
Houses
House
2 rooms
49 m2
2 outbuildings
Land
44 m2
-Sols
2025-04-30
188 000 
3 133  /m²(60 m²)
Sale
Houses
House
3 rooms
60 m2
Land
108 m2
-Sols
2025-04-23
205 000 
133  /m²(1536 m²)
2 662  /m²(77 m²)
Sale
Apartments
Apartment
2 rooms
77 m2
Commercial property
1054 m2
Commercial property
405 m2
1 outbuilding
2025-04-08
253 000 
3 048  /m²(83 m²)
Sale
Houses
House
4 rooms
83 m2
Land
11540 m2
-Terrains d'agrément
/Parc
Land
1198 m2
-Sols
2025-03-21
455 000 
2 433  /m²(187 m²)
Sale
Houses
House
4 rooms
187 m2
Land
731 m2
-Sols
2025-03-21
155 000 
550  /m²(282 m²)
2 214  /m²(70 m²)
Sale
Houses
House
4 rooms
70 m2
Commercial property
212 m2
Land
340 m2
-Sols
2025-03-17
177 450 
2 499  /m²(71 m²)
Sale
Houses
House
4 rooms
71 m2
Land
444 m2
-Sols
2025-03-14
200 000 
2 857  /m²(70 m²)
Sale
Apartments
Apartment
2 rooms
70 m2
3 outbuildings
2025-03-13
110 000 
1 375  /m²(80 m²)
Sale
Houses
House
2 rooms
80 m2
1 outbuilding
Land
157 m2
-Sols
2025-02-25
210 000 
2 838  /m²(74 m²)
Sale
Houses
House
3 rooms
74 m2
Land
349 m2
-Sols
2025-02-24
245 000 
2 882  /m²(85 m²)
Sale
Houses
House
4 rooms
85 m2
Land
81 m2
-Sols
2025-02-24
255 000 
2 742  /m²(93 m²)
Sale
Houses
House
5 rooms
93 m2
Land
500 m2
-Sols
Land
565 m2
-Terrains d'agrément
/Parc
2025-02-17
314 500 
4 625  /m²(68 m²)
Sale
Houses
House
4 rooms
68 m2
1 outbuilding
Land
487 m2
-Sols
2025-02-17
172 000 
2 205  /m²(78 m²)
Sale
Houses
House
4 rooms
78 m2
1 outbuilding
Land
187 m2
-Sols
Land
20 m2
-Sols
Land
159 m2
-Sols
2025-01-20
230 000 
2 584  /m²(89 m²)
Sale
Houses
House
5 rooms
89 m2
Land
551 m2
-Sols
2025-01-16
753 249 
4 185  /m²(180 m²)
Sale
Houses
House
7 rooms
180 m2
1 outbuilding
Land
1000 m2
-Sols
Land
3930 m2
-Terrains d'agrément
/Parc
Land
668 m2
-Taillis simples
Land
4292 m2
-Taillis simples
2024-12-20
266 000 
2 771  /m²(96 m²)
Sale
Houses
House
4 rooms
96 m2
Land
273 m2
-Sols
2024-12-17
165 000 
2 845  /m²(58 m²)
Sale
Apartments
Apartment
3 rooms
58 m2
2 outbuildings
2024-12-17
333 400 
2 850  /m²(117 m²)
Sale
Houses
House
5 rooms
117 m2
Land
499 m2
-Sols
598 transactions listed in the municipality

Indre-et-Loire (37)

Most expensive cities

City
name
Descending orderHouses
house
Price per m²
3 030 
2 860 
2 826 
2 791 
2 749 
2 730 
2 679 
City
name
Descending orderApartments
apt.
Price per m²
7 176 
2 953 
2 839 
2 791 
2 788 
2 758 

Least expensive cities

City
name
Ascending orderHouses
house
Price per m²
694 
729 
766 
802 
818 
845 
City
name
Ascending orderApartments
apt.
Price per m²
98 
209 
299 
452