emooki
HomePrice mapTransactions
🇬🇧 English🇫🇷 Français🇩🇪 Deutsch🇪🇸 Español🇮🇹 Italiano

Real estate price map


Real estate price map in the municipality of Château-Renault.

Indre-et-Loire (37)
Château-Renault

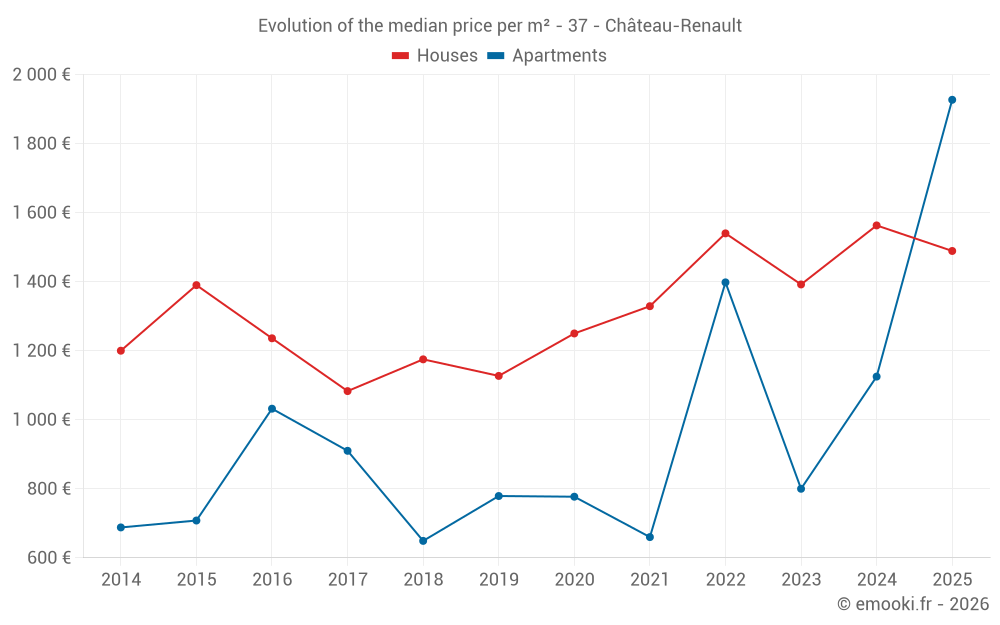
Median price of real estate
in the municipality of Château-Renault

HousesHouses
1 489  /m²
1-23-45-67-89-10
Reliability 9/10
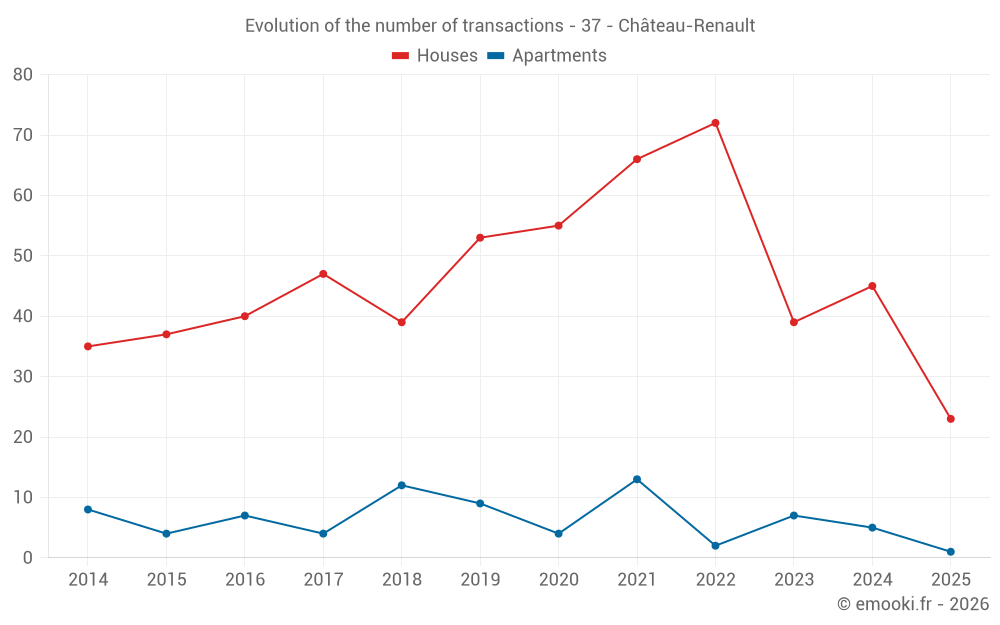
Median price on the 23 transactions of the last 6 months.
from 1 008 to
1 929  /m²
60% of transactions from the 2nd to the 8th deciles.
ApartmentsApartments
1 046  /m²
1-23-45-67-89-10
Reliability 6/10
Median price on the 14 transactions of the last 36 months.
from 580 to
1 368  /m²
60% of transactions from the 2nd to the 8th deciles.
DwellingsDwellings
1 524  /m²
1-23-45-67-89-10
Reliability 9/10
Median price on the 24 transactions of the last 6 months.
from 1 025 to
1 937  /m²
60% of transactions from the 2nd to the 8th deciles.
HousesEvolution of the price per m² of houses since...
1 year
-4.7%
2 years
+7%
3 years
-3.3%
4 years
+12%
5 years
+19%
6 years
+32%
7 years
+27%
8 years
+37%
9 years
+20%
10 years
+7.1%
11 years
+24%
ApartmentsEvolution of the price per m² of apartments since...
1 year
--
2 years
--
3 years
--
4 years
--
5 years
--
6 years
--
7 years
--
8 years
--
9 years
--
10 years
--
11 years
--

Yearly evolution

Evolution of the median price per m²

Evolution of the number of transactions

Warning, last year incomplete. Projections made based on the proportions between semesters of the previous year at the departmental/national level and by type of property.

Yearly data

Descending order
Year
Houses
house
transactions
Houses
house
Price per m²
Apartments
apt.
transactions
Apartments
apt.
Price per m²
2025
23
1 489 
1
1 927 
2024
45
1 563 
5
1 125 
2023
39
1 392 
7
800 
2022
72
1 540 
2
1 398 
2021
66
1 329 
13
660 
2020
55
1 250 
4
777 
2019
53
1 127 
9
779 
2018
39
1 175 
12
649 
2017
47
1 083 
4
910 
2016
40
1 236 
7
1 032 
2015
37
1 390 
4
708 
2014
35
1 200 
8
688 

Analysis

Structure of prices per m²

Values of price percentiles per m² over the periods used for the estimated price of each type of property.

Structure of transaction amounts

Values of transaction amounts percentiles over the periods used for the estimated price of each type of property.

Transaction amounts and prices per m² by percentile

Ascending order
Percentile
Houses
house
Price per m²
Houses
house
Transaction amount
Apartments
apt.
Price per m²
Apartments
apt.
Transaction amount
10th percentile
741 
65 840 
422 
28 000 
20th percentile
1 008 
76 648 
580 
32 817 
30th percentile
1 210 
89 600 
786 
44 103 
40th percentile
1 403 
92 628 
1 038 
59 280 
50th percentile
1 489 
106 K
1 046 
61 500 
60th percentile
1 619 
123 K
1 109 
86 600 
70th percentile
1 844 
137 K
1 180 
100 K
80th percentile
1 929 
145 K
1 368 
102 K
90th percentile
2 069 
170 K
1 522 
221 K

National and departmental comparison

Evolution of the median price per m² of houses

Evolution of the median price per m² of apartments

Quarterly evolution

Evolution of the median price per m²

Evolution of the number of transactions

Quarterly data

Descending order
Quarter
Houses
house
transactions
Houses
house
Price per m²
Apartments
apt.
transactions
Apartments
apt.
Price per m²
2025 Q2
9
1 558 
0
--- 
2025 Q1
14
1 486 
1
1 927 
2024 Q4
13
1 542 
2
1 086 
2024 Q3
12
1 868 
2
883 
2024 Q2
9
1 294 
1
1 471 
2024 Q1
11
1 687 
0
--- 
2023 Q4
10
1 468 
1
800 
2023 Q3
8
1 498 
3
1 037 
2023 Q2
11
1 392 
2
302 
2023 Q1
10
1 197 
1
1 167 
2022 Q4
16
1 438 
1
1 044 
2022 Q3
19
1 698 
0
--- 
2022 Q2
20
1 514 
1
1 753 
2022 Q1
17
1 519 
0
--- 
2021 Q4
14
1 765 
2
780 
2021 Q3
20
1 210 
5
966 
2021 Q2
19
1 329 
2
610 
2021 Q1
13
1 268 
4
519 
2020 Q4
19
1 391 
1
639 
2020 Q3
11
1 253 
1
775 
2020 Q2
15
1 196 
1
779 
2020 Q1
10
1 228 
1
940 
2019 Q4
10
1 400 
3
826 
2019 Q3
16
1 209 
2
476 
2019 Q2
15
667 
1
1 047 
2019 Q1
12
1 112 
3
709 
2018 Q4
12
1 116 
4
622 
2018 Q3
9
1 370 
4
401 
2018 Q2
6
942 
2
750 
2018 Q1
12
1 333 
2
850 
2017 Q4
14
1 066 
0
--- 
2017 Q3
13
1 480 
1
1 143 
2017 Q2
11
968 
1
676 
2017 Q1
9
1 125 
2
929 
2016 Q4
9
1 489 
1
1 070 
2016 Q3
16
1 254 
4
684 
2016 Q2
5
834 
0
--- 
2016 Q1
10
1 159 
2
1 056 
2015 Q4
7
809 
1
345 
2015 Q3
14
1 416 
1
1 489 
2015 Q2
11
1 480 
2
657 
2015 Q1
5
952 
0
--- 
2014 Q4
7
1 324 
0
--- 
2014 Q3
9
1 136 
2
803 
2014 Q2
12
1 000 
3
780 
2014 Q1
7
1 200 
3
540 

Indre-et-Loire (37)

Most expensive cities

City
name
Descending orderHouses
house
Price per m²
3 030 
2 860 
2 826 
2 791 
2 749 
2 730 
2 679 
City
name
Descending orderApartments
apt.
Price per m²
7 176 
2 953 
2 839 
2 791 
2 788 
2 758 

Least expensive cities

City
name
Ascending orderHouses
house
Price per m²
694 
729 
766 
802 
818 
845 
City
name
Ascending orderApartments
apt.
Price per m²
98 
209 
299 
452