emooki
HomePrice mapTransactions
🇬🇧 English🇫🇷 Français🇩🇪 Deutsch🇪🇸 Español🇮🇹 Italiano

Real estate price map


Real estate price map in the municipality of Sougé.

Indre (36)
Sougé

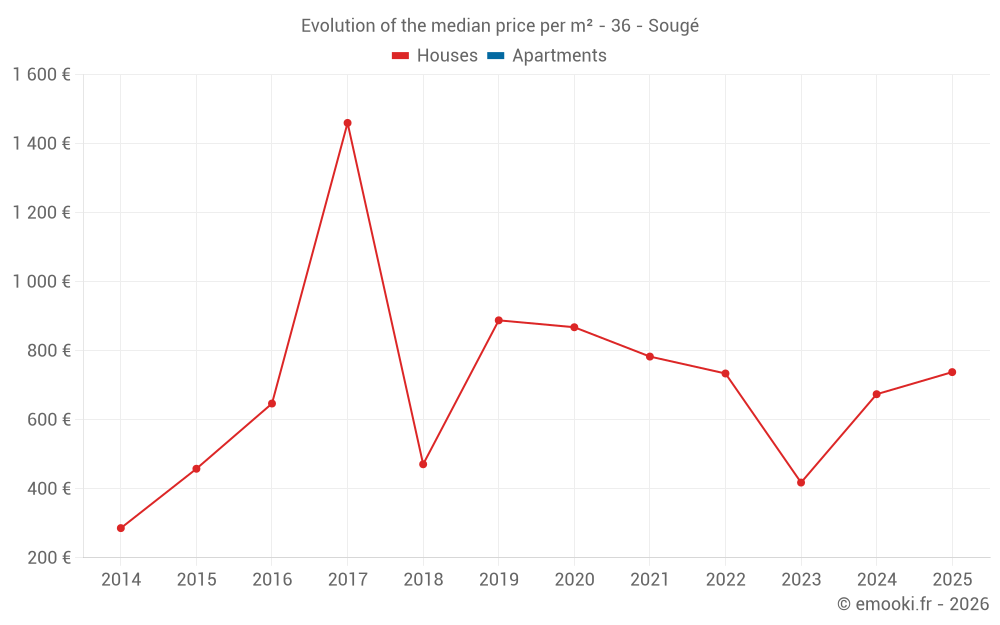
Median price of real estate
in the municipality of Sougé

HousesHouses
721  /m²
1-23-45-67-89-10
Reliability 4/10
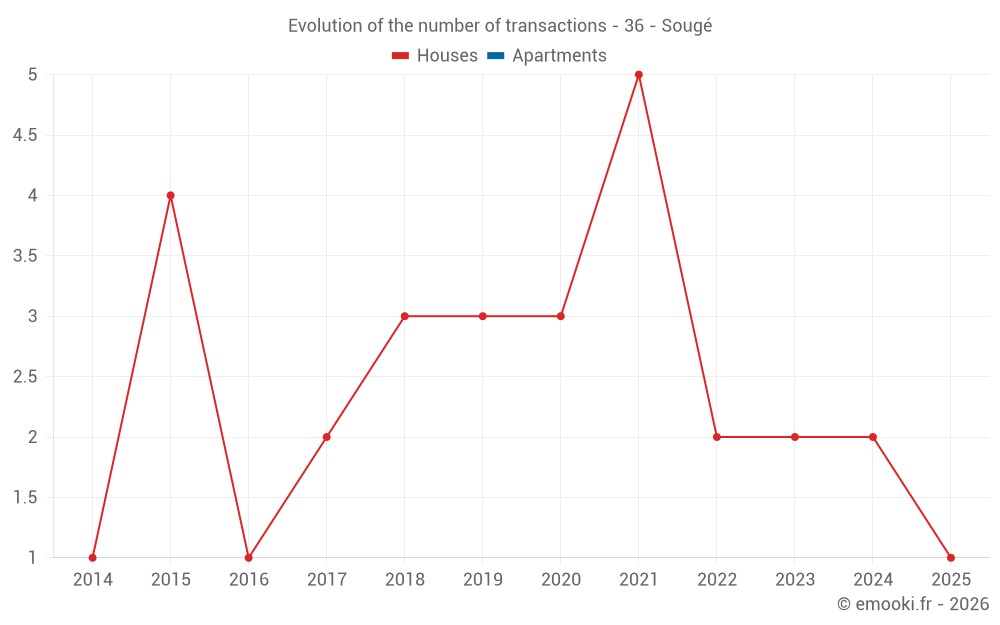
Median price on the 14 transactions of the last 60 months.
from 602 to
859  /m²
60% of transactions from the 2nd to the 8th deciles.
HousesEvolution of the price per m² of houses since...
1 year
--
2 years
--
3 years
--
4 years
--
5 years
--
6 years
--
7 years
--
8 years
--
9 years
--
10 years
--
11 years
--
ApartmentsEvolution of the price per m² of apartments since...
1 year
--
2 years
--
3 years
--
4 years
--
5 years
--
6 years
--
7 years
--
8 years
--
9 years
--
10 years
--
11 years
--

Yearly evolution

Evolution of the median price per m²

Evolution of the number of transactions

Warning, last year incomplete. Projections made based on the proportions between semesters of the previous year at the departmental/national level and by type of property.

Yearly data

Descending order
Year
Houses
house
transactions
Houses
house
Price per m²
Apartments
apt.
transactions
Apartments
apt.
Price per m²
2025
1
738 
0
--- 
2024
2
674 
0
--- 
2023
2
418 
0
--- 
2022
2
734 
0
--- 
2021
5
783 
0
--- 
2020
3
868 
0
--- 
2019
3
888 
0
--- 
2018
3
471 
0
--- 
2017
2
1 460 
0
--- 
2016
1
647 
0
--- 
2015
4
458 
0
--- 
2014
1
286 
0
--- 

Analysis

Structure of prices per m²

Values of price percentiles per m² over the periods used for the estimated price of each type of property.

Structure of transaction amounts

Values of transaction amounts percentiles over the periods used for the estimated price of each type of property.

Transaction amounts and prices per m² by percentile

Ascending order
Percentile
Houses
house
Price per m²
Houses
house
Transaction amount
Apartments
apt.
Price per m²
Apartments
apt.
Transaction amount
10th percentile
480 
41 671 
--- 
--- 
20th percentile
602 
50 000 
--- 
--- 
30th percentile
654 
64 400 
--- 
--- 
40th percentile
695 
66 800 
--- 
--- 
50th percentile
721 
71 000 
--- 
--- 
60th percentile
750 
86 400 
--- 
--- 
70th percentile
777 
95 500 
--- 
--- 
80th percentile
859 
102 K
--- 
--- 
90th percentile
1 062 
129 K
--- 
--- 

National and departmental comparison

Evolution of the median price per m² of houses

Evolution of the median price per m² of apartments

Quarterly evolution

Evolution of the median price per m²

Evolution of the number of transactions

Quarterly data

Descending order
Quarter
Houses
house
transactions
Houses
house
Price per m²
Apartments
apt.
transactions
Apartments
apt.
Price per m²
2025 Q2
1
738 
0
--- 
2024 Q2
2
674 
0
--- 
2023 Q3
2
418 
0
--- 
2022 Q3
2
734 
0
--- 
2021 Q2
3
973 
0
--- 
2021 Q1
2
555 
0
--- 
2020 Q3
2
926 
0
--- 
2020 Q1
1
868 
0
--- 
2019 Q4
3
888 
0
--- 
2018 Q4
1
627 
0
--- 
2018 Q2
1
471 
0
--- 
2018 Q1
1
5 
0
--- 
2017 Q2
2
1 460 
0
--- 
2016 Q2
1
647 
0
--- 
2015 Q4
1
2 588 
0
--- 
2015 Q3
2
442 
0
--- 
2015 Q2
1
458 
0
--- 
2014 Q3
1
286 
0
--- 

Indre (36)

Most expensive cities

City
name
Descending orderHouses
house
Price per m²
1 667 
1 634 
1 554 
1 515 
1 429 
1 392 
1 372 
1 364 
1 363 
City
name
Descending orderApartments
apt.
Price per m²
14 286 
1 748 
1 452 
1 264 
1 244 
1 241 
1 062 
1 029 

Least expensive cities

City
name
Ascending orderHouses
house
Price per m²
381 
385 
395 
400 
530 
543 
550 
City
name
Ascending orderApartments
apt.
Price per m²
39 
194 
278 
284 
286 
289