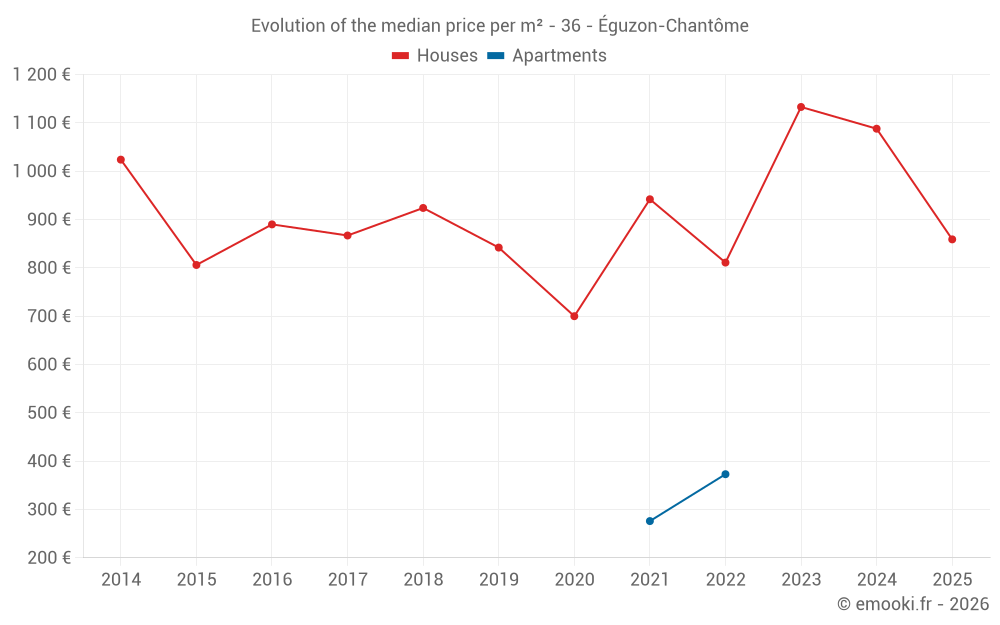
Median price of real estate
in the municipality of Éguzon-Chantôme
Houses
1 038 € /m²
Reliability 8/10
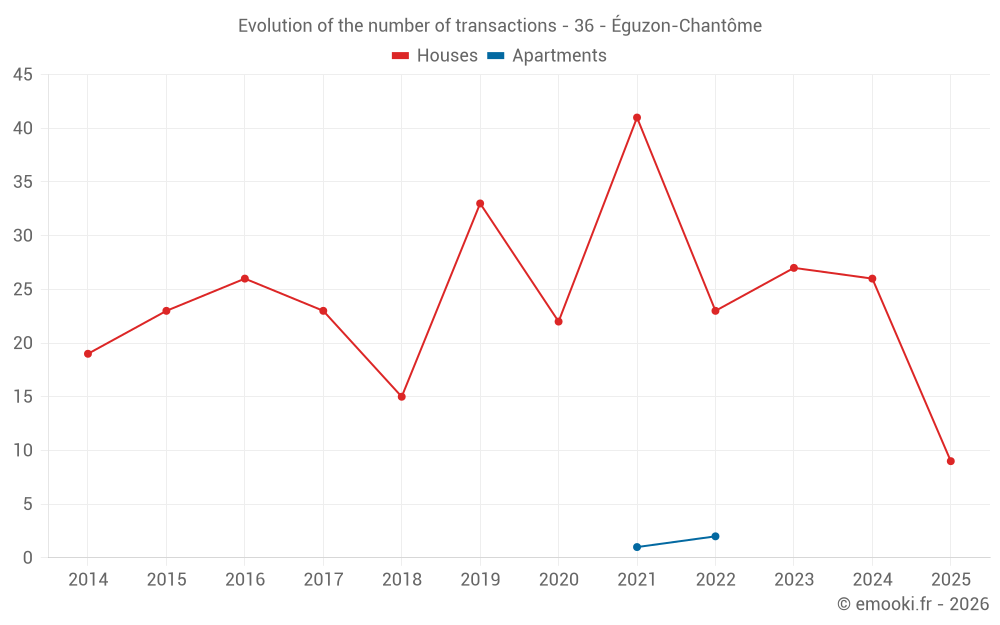
Median price on the 28 transactions of the last 12 months.
from 800 to
1 436 € /m²
1 436 € /m²
60% of transactions from the 2nd to the 8th deciles.
Apartments
291 € /m²
Reliability 1/10
Median price on the 3 transactions of the last 120 months.
Dwellings
1 038 € /m²
Reliability 8/10
Median price on the 28 transactions of the last 12 months.
from 800 to
1 436 € /m²
1 436 € /m²
60% of transactions from the 2nd to the 8th deciles.