Real estate price map
Real estate price map in the municipality of Châtillon-sur-Indre, choose a section to see transactions by parcel.
Indre (36)
Price per m² in Châtillon-sur-Indre
Median price of real estate
in the municipality of Châtillon-sur-Indre
Houses
825 € /m²
Reliability 8/10
Median price on the 33 transactions of the last 12 months.
from 460 to
1 280 € /m²
1 280 € /m²
60% of transactions from the 2nd to the 8th deciles.
Apartments
385 € /m²
Reliability 5/10
Median price on the 10 transactions of the last 48 months.
Dwellings
969 € /m²
Reliability 9/10
Median price on the 19 transactions of the last 6 months.
from 484 to
1 354 € /m²
1 354 € /m²
60% of transactions from the 2nd to the 8th deciles.
Evolution of the price per m² of houses since...
1 year
+14%
2 years
+8.6%
3 years
-8.8%
4 years
+0.6%
5 years
-8.9%
6 years
-2.1%
7 years
+11%
8 years
+32%
9 years
-10%
10 years
+13%
11 years
-22%
The price per m² of houses has increased by 32% since 8 years, but it has decreased by 22% in 11 years.
721 transactions listed in the municipality
Yearly data
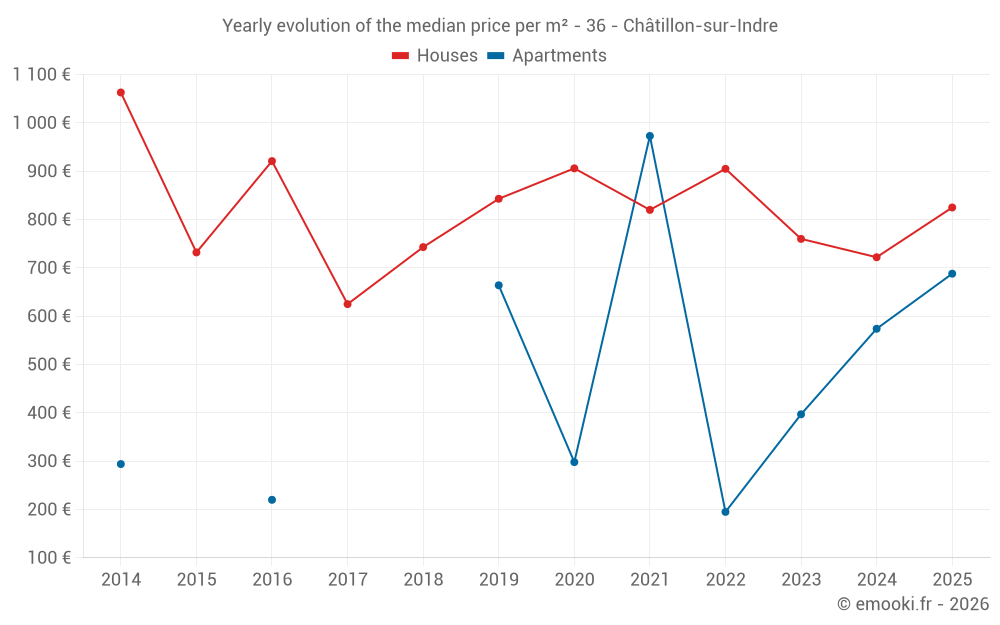
Yearly evolution of the median price per m²
Yearly evolution of the number of transactions

Yearly table
Year
house
transactions
transactions
house
Price per m²
Price per m²
apt.
transactions
transactions
apt.
Price per m²
Price per m²
2025
33
825 €
3
688 €
2024
39
722 €
2
574 €
2023
44
760 €
1
397 €
2022
61
905 €
4
195 €
2021
48
820 €
1
973 €
2020
39
906 €
2
298 €
2019
28
843 €
2
664 €
2018
18
743 €
0
--- €
2017
21
625 €
0
--- €
2016
24
921 €
4
220 €
2015
20
732 €
0
--- €
2014
18
1 063 €
3
294 €
Analysis
Structure of prices per m²
Values of price percentiles per m² over the periods used for the estimated price of each type of property.
Structure of transaction amounts
Values of transaction amounts percentiles over the periods used for the estimated price of each type of property.
Transaction amounts and prices per m² by percentile
Percentile
house
Price per m²
Price per m²
house
Transaction amount
Transaction amount
apt.
Price per m²
Price per m²
apt.
Transaction amount
Transaction amount
10th percentile
285 €
22 600 €
131 €
18 600 €
20th percentile
460 €
30 520 €
233 €
27 000 €
30th percentile
652 €
39 600 €
285 €
30 400 €
40th percentile
740 €
51 600 €
342 €
31 600 €
50th percentile
825 €
60 000 €
385 €
32 666 €
60th percentile
981 €
80 000 €
513 €
35 889 €
70th percentile
1 092 €
85 400 €
714 €
39 940 €
80th percentile
1 280 €
98 800 €
813 €
43 359 €
90th percentile
1 619 €
116 K€
1 012 €
55 500 €
National and departmental comparison
Evolution of the median price per m² of houses
Evolution of the median price per m² of apartments
Quarterly data
Quarterly evolution of the median price per m²
Quarterly evolution of the number of transactions
Quarterly table
Quarter
house
transactions
transactions
house
Price per m²
Price per m²
apt.
transactions
transactions
apt.
Price per m²
Price per m²
2025 Q4
5
1 063 €
1
688 €
2025 Q3
11
744 €
2
876 €
2025 Q2
11
859 €
0
--- €
2025 Q1
6
756 €
0
--- €
2024 Q4
9
825 €
0
--- €
2024 Q3
10
1 036 €
1
775 €
2024 Q2
15
714 €
1
373 €
2024 Q1
5
395 €
0
--- €
2023 Q4
12
691 €
0
--- €
2023 Q3
6
812 €
0
--- €
2023 Q2
17
873 €
1
397 €
2023 Q1
9
772 €
0
--- €
2022 Q4
12
972 €
1
963 €
2022 Q3
16
968 €
1
258 €
2022 Q2
19
801 €
1
132 €
2022 Q1
14
804 €
1
124 €
2021 Q4
16
1 005 €
0
--- €
2021 Q3
13
713 €
1
973 €
2021 Q2
14
1 048 €
0
--- €
2021 Q1
5
667 €
0
--- €
2020 Q4
16
905 €
1
59 €
2020 Q3
12
902 €
1
538 €
2020 Q2
5
855 €
0
--- €
2020 Q1
6
981 €
0
--- €
2019 Q4
9
494 €
1
789 €
2019 Q3
4
964 €
1
538 €
2019 Q2
7
1 125 €
0
--- €
2019 Q1
8
794 €
0
--- €
2018 Q4
6
558 €
0
--- €
2018 Q3
2
790 €
0
--- €
2018 Q2
7
716 €
0
--- €
2018 Q1
3
1 250 €
0
--- €
2017 Q4
5
963 €
0
--- €
2017 Q3
10
544 €
0
--- €
2017 Q2
4
671 €
0
--- €
2017 Q1
2
614 €
0
--- €
2016 Q4
10
953 €
1
52 €
2016 Q3
5
1 029 €
1
388 €
2016 Q2
7
545 €
2
258 €
2016 Q1
2
608 €
0
--- €
2015 Q4
5
516 €
0
--- €
2015 Q3
8
708 €
0
--- €
2015 Q2
2
817 €
0
--- €
2015 Q1
5
728 €
0
--- €
2014 Q4
3
1 250 €
1
294 €
2014 Q3
4
1 522 €
2
256 €
2014 Q2
6
1 152 €
0
--- €
2014 Q1
5
779 €
0
--- €
Key takeaways
What is the price per m2 of houses in Châtillon-sur-Indre?
The median price on the 33 house transactions of the last 12 months in the municipality of Châtillon-sur-Indre was 825 € per square meter for a median property value of 60 000 €. Over this period, 60% of transactions were between 460 and 1 280 € per square meter (from the 2nd to the 8th deciles).
Compare with neighboring municipalities
City
name
name
house
Price per m²
Price per m²
apt.
Price per m²
Price per m²
City information
Zip code
- 36700 CHATILLON SUR INDRE