emooki
HomePrice mapTransactions
🇬🇧 English🇫🇷 Français🇩🇪 Deutsch🇪🇸 Español🇮🇹 Italiano

Real estate price map


Real estate price map in the municipality of Saint-Didier, choose a section to see transactions by parcel.

Ille-et-Vilaine (35)

Saint-Didier - Real estate price m²

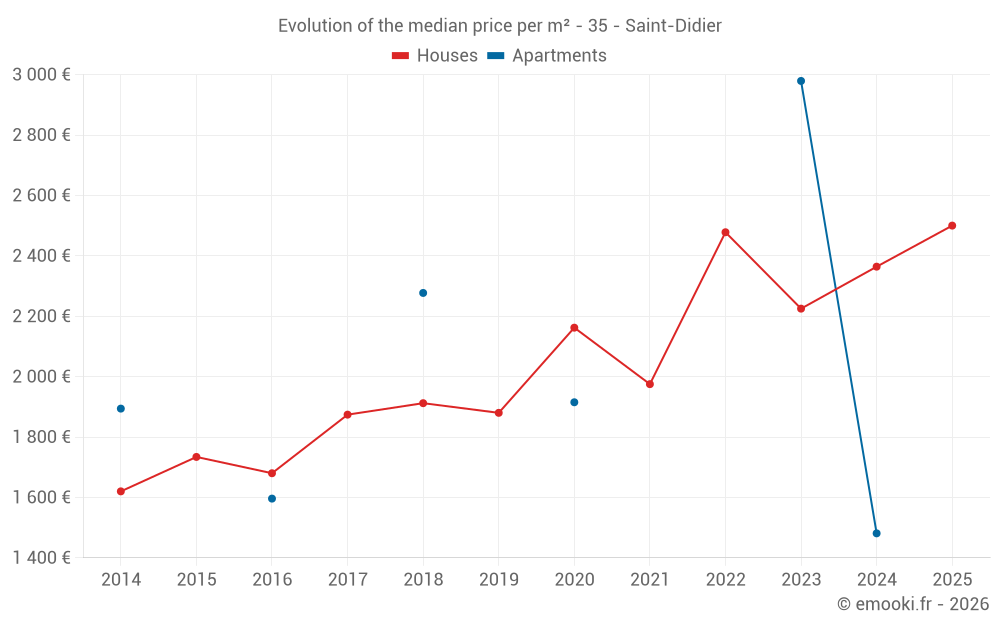
Median price of real estate
in the municipality of Saint-Didier

HousesHouses
2 372  /m²
1-23-45-67-89-10
Reliability 7/10
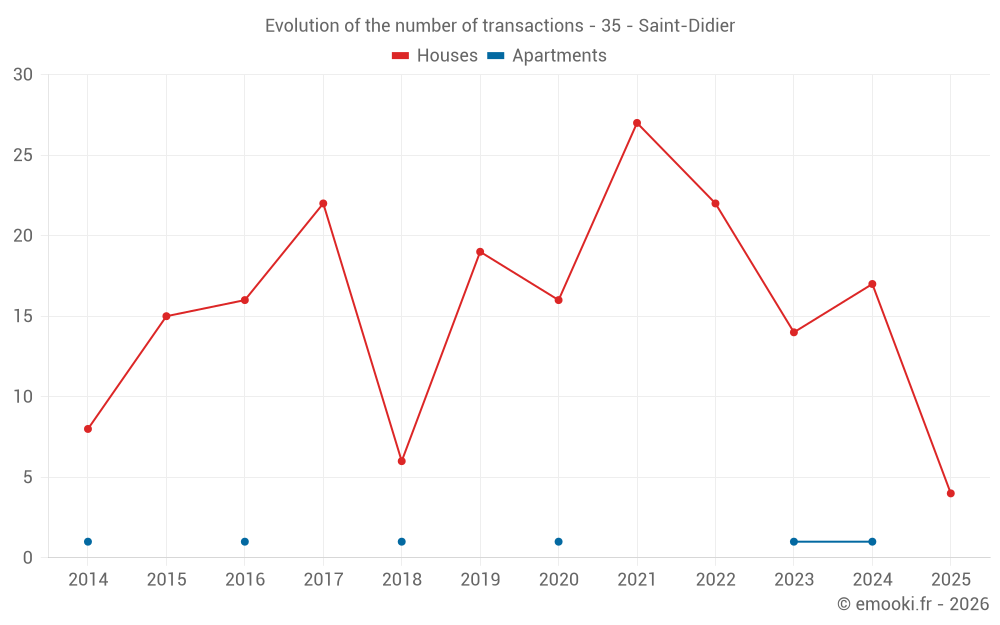
Median price on the 27 transactions of the last 24 months.
from 1 903 to
2 555  /m²
60% of transactions from the 2nd to the 8th deciles.
ApartmentsApartments
2 096  /m²
1-23-45-67-89-10
Reliability 2/10
Median price on the 4 transactions of the last 96 months.
DwellingsDwellings
2 368  /m²
1-23-45-67-89-10
Reliability 7/10
Median price on the 28 transactions of the last 24 months.
from 1 756 to
2 550  /m²
60% of transactions from the 2nd to the 8th deciles.
HousesEvolution of the price per m² of houses since...
1 year
+5.8%
2 years
+12%
3 years
+0.9%
4 years
+27%
5 years
+16%
6 years
+33%
7 years
+31%
8 years
+33%
9 years
+49%
10 years
+44%
11 years
+54%

Yearly evolution

Evolution of the median price per m²

Evolution of the median price per m² - 35 - Saint-Didier

Evolution of the number of transactions

Warning, last year incomplete. Projections made based on the proportions between semesters of the previous year at the departmental/national level and by type of property.

Evolution of the number of transactions - 35 - Saint-Didier

Yearly data

Descending order
Year
Houses
house
transactions
Houses
house
Price per m²
Apartments
apt.
transactions
Apartments
apt.
Price per m²
2025
4
2 500 
0
--- 
2024
17
2 364 
1
1 481 
2023
14
2 225 
1
2 979 
2022
22
2 478 
0
--- 
2021
27
1 975 
0
--- 
2020
16
2 162 
1
1 915 
2019
19
1 880 
0
--- 
2018
6
1 912 
1
2 277 
2017
22
1 874 
0
--- 
2016
16
1 680 
1
1 596 
2015
15
1 734 
0
--- 
2014
8
1 620 
1
1 894 

Analysis

Structure of prices per m²

Values of price percentiles per m² over the periods used for the estimated price of each type of property.

Structure of transaction amounts

Values of transaction amounts percentiles over the periods used for the estimated price of each type of property.

Transaction amounts and prices per m² by percentile

Ascending order
Percentile
Houses
house
Price per m²
Houses
house
Transaction amount
Apartments
apt.
Price per m²
Apartments
apt.
Transaction amount
10th percentile
1 134 
140 K
1 611 
95 100 
20th percentile
1 903 
165 K
1 741 
100 K
30th percentile
2 064 
203 K
1 872 
105 K
40th percentile
2 238 
221 K
1 987 
114 K
50th percentile
2 372 
245 K
2 096 
124 K
60th percentile
2 435 
268 K
2 205 
133 K
70th percentile
2 492 
299 K
2 347 
142 K
80th percentile
2 555 
305 K
2 558 
148 K
90th percentile
2 827 
320 K
2 768 
154 K

National and departmental comparison

Evolution of the median price per m² of houses

Evolution of the median price per m² of apartments

Quarterly evolution

Evolution of the median price per m²

Evolution of the number of transactions

Quarterly data

Descending order
Quarter
Houses
house
transactions
Houses
house
Price per m²
Apartments
apt.
transactions
Apartments
apt.
Price per m²
2025 Q1
4
2 500 
0
--- 
2024 Q4
5
2 519 
0
--- 
2024 Q3
3
2 037 
1
1 481 
2024 Q2
5
2 295 
0
--- 
2024 Q1
4
2 376 
0
--- 
2023 Q4
2
2 100 
0
--- 
2023 Q3
4
2 523 
0
--- 
2023 Q2
4
2 149 
1
2 979 
2023 Q1
4
1 892 
0
--- 
2022 Q4
1
2 783 
0
--- 
2022 Q3
10
2 283 
0
--- 
2022 Q2
7
2 490 
0
--- 
2022 Q1
4
2 260 
0
--- 
2021 Q4
7
2 000 
0
--- 
2021 Q3
6
2 154 
0
--- 
2021 Q2
3
2 684 
0
--- 
2021 Q1
11
1 912 
0
--- 
2020 Q4
5
2 137 
1
1 915 
2020 Q3
5
1 968 
0
--- 
2020 Q2
2
2 806 
0
--- 
2020 Q1
4
2 350 
0
--- 
2019 Q4
3
1 880 
0
--- 
2019 Q3
4
2 092 
0
--- 
2019 Q2
6
1 989 
0
--- 
2019 Q1
6
1 692 
0
--- 
2018 Q4
0
--- 
1
2 277 
2018 Q3
4
1 912 
0
--- 
2018 Q2
1
1 541 
0
--- 
2018 Q1
1
2 188 
0
--- 
2017 Q4
5
1 930 
0
--- 
2017 Q3
2
1 661 
0
--- 
2017 Q2
8
1 904 
0
--- 
2017 Q1
7
1 748 
0
--- 
2016 Q4
7
1 625 
0
--- 
2016 Q3
3
1 736 
0
--- 
2016 Q2
2
1 130 
0
--- 
2016 Q1
4
1 920 
1
1 596 
2015 Q4
3
1 979 
0
--- 
2015 Q3
6
1 830 
0
--- 
2015 Q2
2
1 424 
0
--- 
2015 Q1
4
1 808 
0
--- 
2014 Q4
4
1 649 
0
--- 
2014 Q3
2
2 111 
0
--- 
2014 Q2
2
1 443 
1
1 894 

Overview of the latest real estate transactions

The following list is an anonymized overview of the latest transactions. For more details and to find all transactions, please use the map to view transactions by plot or the transaction search page for a search by criteria.

2025-06-18
84 000 
Sale
Land
525 m2
-Terrains à bâtir
2025-06-02
2 660 
Sale
Land
133 m2
-Sols
2025-04-29
160 
Sale
Land
8 m2
-Terrains d'agrément
/Dépendances d'ensemble immobilier
2025-04-29
212 
Sale
Land
385 m2
-Sols
2025-03-28
1 040 
Sale
Land
52 m2
-Jardins
/Jardin potager
2025-03-28
740 
Sale
Land
37 m2
-Jardins
/Jardin potager
2025-03-28
620 
Sale
Land
31 m2
-Jardins
/Jardin potager
2025-03-27
215 311 
2 533  /m²(85 m²)
Sale
Houses
House
4 rooms
85 m2
Land
415 m2
-Sols
2025-03-19
299 150 
2 720  /m²(110 m²)
Sale
Houses
House
5 rooms
110 m2
Land
544 m2
-Sols
2025-03-18
295 500 
1 870  /m²(158 m²)
Sale
Houses
House
7 rooms
158 m2
Land
452 m2
-Sols
Land
460 m2
-Sols
2025-03-17
180 000 
2 466  /m²(73 m²)
Sale
Houses
House
3 rooms
73 m2
Land
3770 m2
-Terres
Land
1760 m2
-Sols
Land
5340 m2
-Vergers
/CIDRE
Land
2590 m2
-Terres
Land
870 m2
-Jardins
/Jardin potager
Land
750 m2
-Sols
2025-03-10
61 920 
Sale
Land
387 m2
-Terrains à bâtir
2025-01-29
72 960 
Sale
Land
456 m2
-Terres
2025-01-21
36 920 
transaction.nature.Vente terrain à bâtir
Land
284 m2
-Terrains à bâtir
2025-01-08
64 960 
Sale
Land
406 m2
-Terrains à bâtir
2025-01-07
32 500 
Sale
Land
250 m2
-Terrains à bâtir
2025-01-07
35 880 
transaction.nature.Vente terrain à bâtir
Land
276 m2
-Terrains à bâtir
2025-01-07
88 960 
Sale
Land
556 m2
-Terrains à bâtir
2024-12-24
68 800 
Sale
Land
430 m2
-Terrains à bâtir
2024-12-20
73 600 
Sale
Land
460 m2
-Terrains à bâtir
418 transactions listed in the municipality

Ille-et-Vilaine (35)

Most expensive cities

City
name
Descending orderHouses
house
Price per m²
5 682 
5 538 
4 545 
4 504 
4 150 
4 118 
3 857 
3 721 
3 714 
City
name
Descending orderApartments
apt.
Price per m²
5 306 
5 061 
4 627 
4 194 
4 011 
3 914 
3 835 
3 755 

Least expensive cities

City
name
Ascending orderHouses
house
Price per m²
982 
1 041 
1 047 
1 111 
1 125 
1 128 
1 150 
City
name
Ascending orderApartments
apt.
Price per m²
238 
267 
315 
352