emooki
HomePrice mapTransactions
🇬🇧 English🇫🇷 Français🇩🇪 Deutsch🇪🇸 Español🇮🇹 Italiano

Real estate price map


Real estate price map in the municipality of Pocé-les-Bois.

Ille-et-Vilaine (35)
Pocé-les-Bois

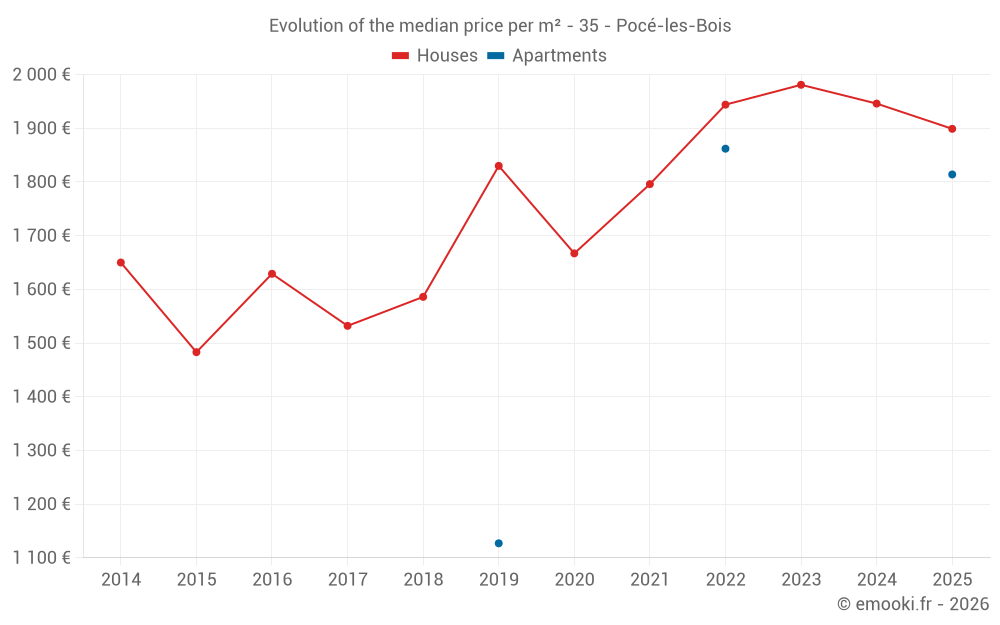
Median price of real estate
in the municipality of Pocé-les-Bois

HousesHouses
1 933  /m²
1-23-45-67-89-10
Reliability 7/10
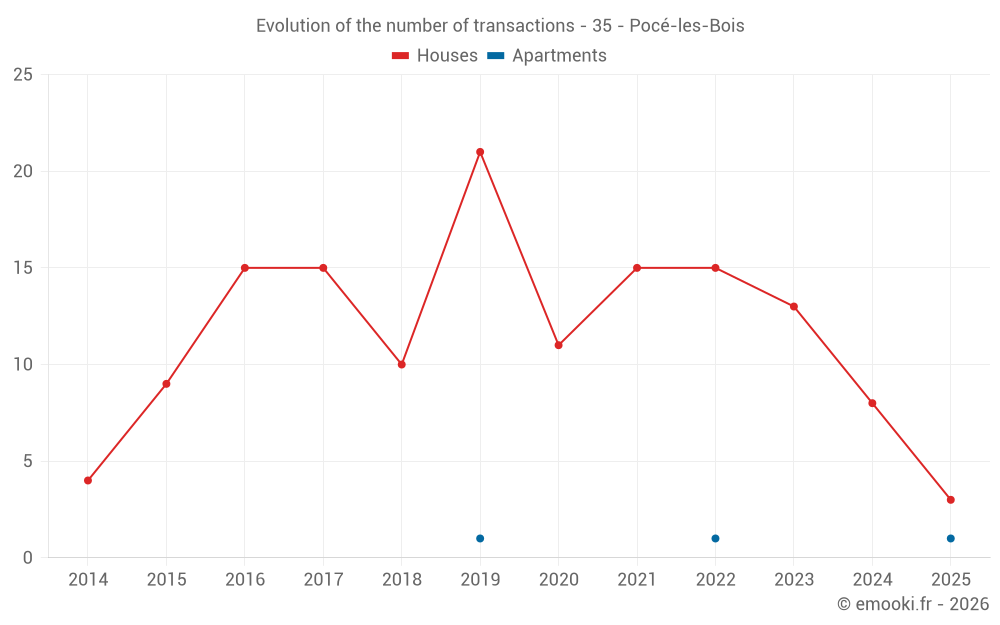
Median price on the 19 transactions of the last 24 months.
from 1 457 to
2 094  /m²
60% of transactions from the 2nd to the 8th deciles.
ApartmentsApartments
1 814  /m²
1-23-45-67-89-10
Reliability 1/10
Median price on the 3 transactions of the last 120 months.
DwellingsDwellings
1 916  /m²
1-23-45-67-89-10
Reliability 7/10
Median price on the 20 transactions of the last 24 months.
from 1 472 to
2 041  /m²
60% of transactions from the 2nd to the 8th deciles.
HousesEvolution of the price per m² of houses since...
1 year
--
2 years
--
3 years
--
4 years
--
5 years
--
6 years
--
7 years
--
8 years
--
9 years
--
10 years
--
11 years
--
ApartmentsEvolution of the price per m² of apartments since...
1 year
--
2 years
--
3 years
--
4 years
--
5 years
--
6 years
--
7 years
--
8 years
--
9 years
--
10 years
--
11 years
--

Yearly evolution

Evolution of the median price per m²

Evolution of the number of transactions

Warning, last year incomplete. Projections made based on the proportions between semesters of the previous year at the departmental/national level and by type of property.

Yearly data

Descending order
Year
Houses
house
transactions
Houses
house
Price per m²
Apartments
apt.
transactions
Apartments
apt.
Price per m²
2025
3
1 899 
1
1 814 
2024
8
1 946 
0
--- 
2023
13
1 981 
0
--- 
2022
15
1 944 
1
1 862 
2021
15
1 796 
0
--- 
2020
11
1 667 
0
--- 
2019
21
1 830 
1
1 127 
2018
10
1 586 
0
--- 
2017
15
1 532 
0
--- 
2016
15
1 629 
0
--- 
2015
9
1 483 
0
--- 
2014
4
1 650 
0
--- 

Analysis

Structure of prices per m²

Values of price percentiles per m² over the periods used for the estimated price of each type of property.

Structure of transaction amounts

Values of transaction amounts percentiles over the periods used for the estimated price of each type of property.

Transaction amounts and prices per m² by percentile

Ascending order
Percentile
Houses
house
Price per m²
Houses
house
Transaction amount
Apartments
apt.
Price per m²
Apartments
apt.
Transaction amount
10th percentile
1 358 
157 K
1 264 
129 K
20th percentile
1 457 
173 K
1 402 
143 K
30th percentile
1 793 
181 K
1 539 
157 K
40th percentile
1 884 
187 K
1 677 
171 K
50th percentile
1 933 
205 K
1 814 
185 K
60th percentile
1 964 
218 K
1 824 
186 K
70th percentile
1 977 
260 K
1 833 
187 K
80th percentile
2 094 
283 K
1 843 
188 K
90th percentile
2 432 
297 K
1 852 
189 K

National and departmental comparison

Evolution of the median price per m² of houses

Evolution of the median price per m² of apartments

Quarterly evolution

Evolution of the median price per m²

Evolution of the number of transactions

Quarterly data

Descending order
Quarter
Houses
house
transactions
Houses
house
Price per m²
Apartments
apt.
transactions
Apartments
apt.
Price per m²
2025 Q2
1
1 414 
0
--- 
2025 Q1
2
2 148 
1
1 814 
2024 Q4
1
2 571 
0
--- 
2024 Q3
3
1 330 
0
--- 
2024 Q2
3
1 958 
0
--- 
2024 Q1
1
1 966 
0
--- 
2023 Q4
3
1 981 
0
--- 
2023 Q3
5
1 880 
0
--- 
2023 Q2
1
2 573 
0
--- 
2023 Q1
4
2 727 
0
--- 
2022 Q4
3
1 747 
0
--- 
2022 Q3
4
1 934 
1
1 862 
2022 Q2
3
2 243 
0
--- 
2022 Q1
5
1 582 
0
--- 
2021 Q4
4
1 523 
0
--- 
2021 Q3
6
1 812 
0
--- 
2021 Q2
4
1 854 
0
--- 
2021 Q1
1
2 375 
0
--- 
2020 Q4
2
1 376 
0
--- 
2020 Q3
6
1 656 
0
--- 
2020 Q2
2
1 516 
0
--- 
2020 Q1
1
1 822 
0
--- 
2019 Q4
9
1 894 
0
--- 
2019 Q3
5
1 542 
1
1 127 
2019 Q2
5
1 933 
0
--- 
2019 Q1
2
1 507 
0
--- 
2018 Q4
2
1 476 
0
--- 
2018 Q3
6
1 626 
0
--- 
2018 Q2
1
1 575 
0
--- 
2018 Q1
1
2 506 
0
--- 
2017 Q4
4
1 582 
0
--- 
2017 Q3
3
2 223 
0
--- 
2017 Q2
2
1 371 
0
--- 
2017 Q1
6
594 
0
--- 
2016 Q4
5
1 548 
0
--- 
2016 Q3
2
1 931 
0
--- 
2016 Q2
1
408 
0
--- 
2016 Q1
7
1 974 
0
--- 
2015 Q4
3
1 514 
0
--- 
2015 Q3
3
1 635 
0
--- 
2015 Q2
2
904 
0
--- 
2015 Q1
1
571 
0
--- 
2014 Q3
1
1 702 
0
--- 
2014 Q2
2
1 282 
0
--- 
2014 Q1
1
1 598 
0
--- 

Ille-et-Vilaine (35)

Most expensive cities

City
name
Descending orderHouses
house
Price per m²
5 682 
5 538 
4 545 
4 504 
4 150 
4 118 
3 857 
3 721 
3 714 
City
name
Descending orderApartments
apt.
Price per m²
5 306 
5 061 
4 627 
4 194 
4 011 
3 914 
3 835 
3 755 

Least expensive cities

City
name
Ascending orderHouses
house
Price per m²
982 
1 041 
1 047 
1 111 
1 125 
1 128 
1 150 
City
name
Ascending orderApartments
apt.
Price per m²
238 
267 
315 
352