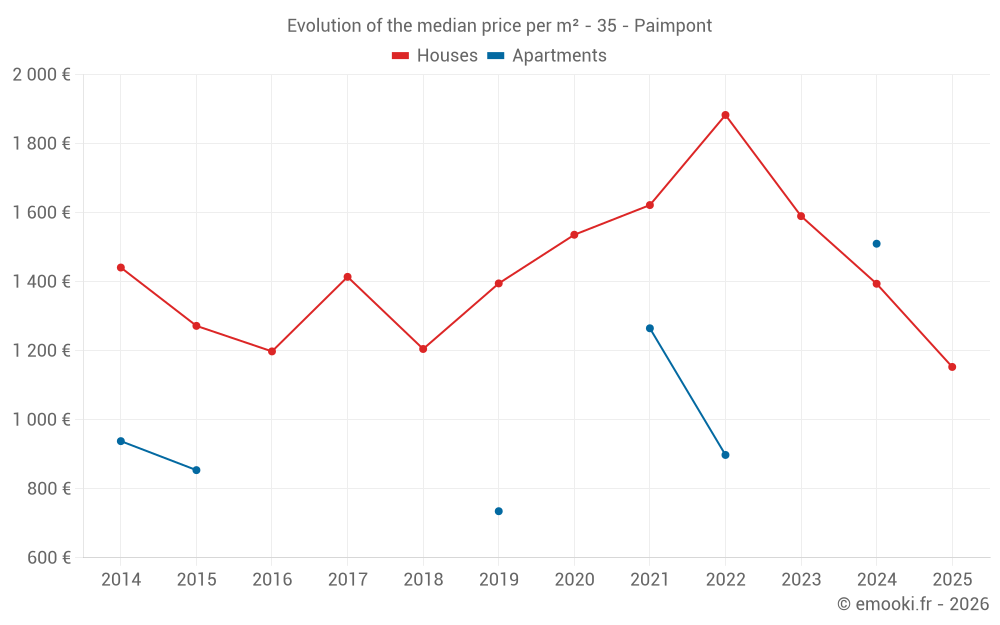
Median price of real estate
in the municipality of Paimpont
Houses
1 527 € /m²
Reliability 8/10
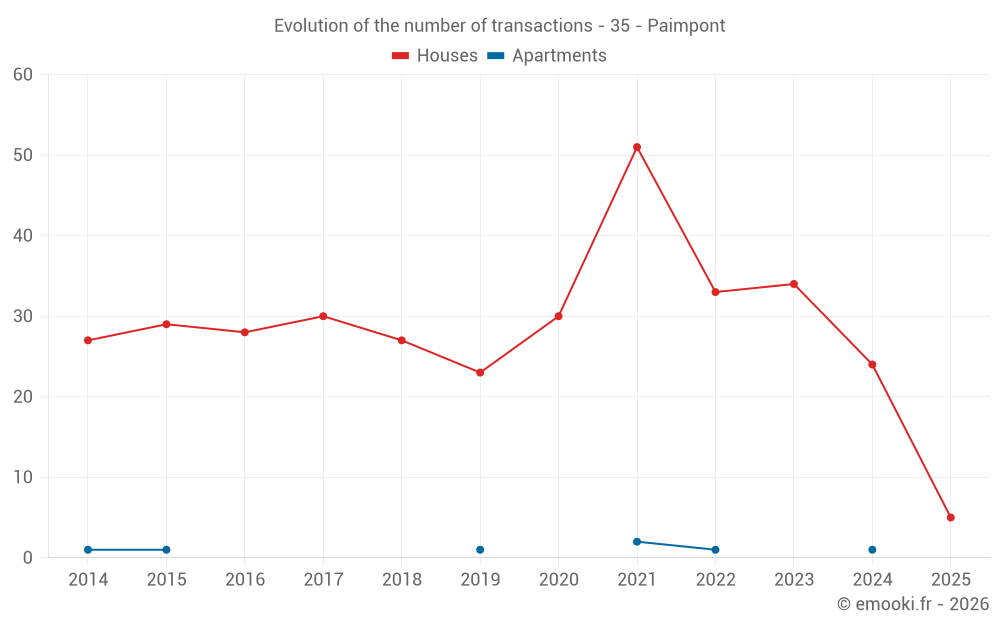
Median price on the 21 transactions of the last 12 months.
from 1 153 to
2 111 € /m²
2 111 € /m²
60% of transactions from the 2nd to the 8th deciles.
Apartments
1 176 € /m²
Reliability 2/10
Median price on the 5 transactions of the last 96 months.
Dwellings
1 527 € /m²
Reliability 8/10
Median price on the 21 transactions of the last 12 months.
from 1 153 to
2 111 € /m²
2 111 € /m²
60% of transactions from the 2nd to the 8th deciles.