emooki
HomePrice mapTransactions
🇬🇧 English🇫🇷 Français🇩🇪 Deutsch🇪🇸 Español🇮🇹 Italiano

Real estate price map


Real estate price map in the municipality of Noyal-sur-Vilaine, choose a section to see transactions by parcel.

Ille-et-Vilaine (35)

Noyal-sur-Vilaine - Real estate price m²

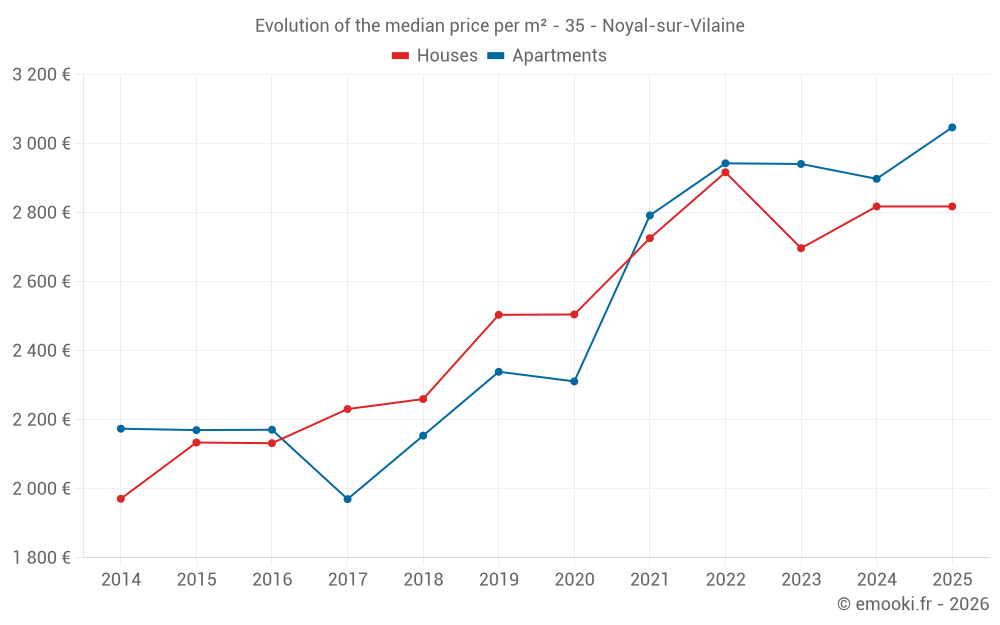
Median price of real estate
in the municipality of Noyal-sur-Vilaine

HousesHouses
2 844  /m²
1-23-45-67-89-10
Reliability 8/10
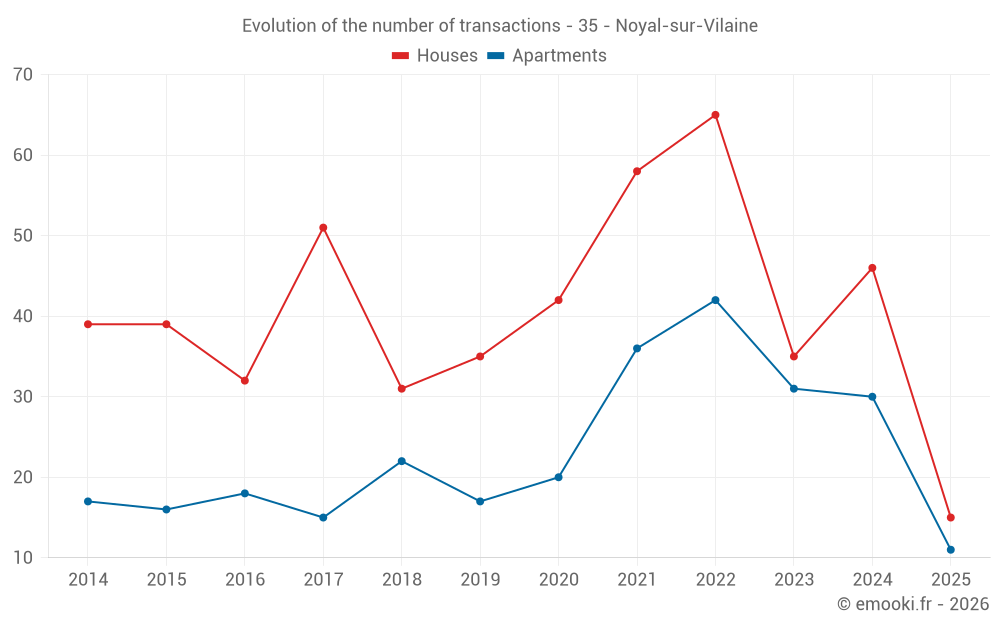
Median price on the 34 transactions of the last 12 months.
from 2 603 to
3 311  /m²
60% of transactions from the 2nd to the 8th deciles.
ApartmentsApartments
3 024  /m²
1-23-45-67-89-10
Reliability 8/10
Median price on the 28 transactions of the last 12 months.
from 2 727 to
3 356  /m²
60% of transactions from the 2nd to the 8th deciles.
DwellingsDwellings
3 000  /m²
1-23-45-67-89-10
Reliability 9/10
Median price on the 26 transactions of the last 6 months.
from 2 719 to
3 524  /m²
60% of transactions from the 2nd to the 8th deciles.
HousesEvolution of the price per m² of houses since...
1 year
0%
2 years
+4.5%
3 years
-3.4%
4 years
+3.4%
5 years
+12%
6 years
+13%
7 years
+25%
8 years
+26%
9 years
+32%
10 years
+32%
11 years
+43%
The price per m² of houses has decreased by 3.4% since 3 years, but it has increased by 43% in 11 years.
ApartmentsEvolution of the price per m² of apartments since...
1 year
+5.1%
2 years
+3.6%
3 years
+3.5%
4 years
+9.1%
5 years
+32%
6 years
+30%
7 years
+41%
8 years
+55%
9 years
+40%
10 years
+40%
11 years
+40%

Yearly evolution

Evolution of the median price per m²

Evolution of the median price per m² - 35 - Noyal-sur-Vilaine

Evolution of the number of transactions

Warning, last year incomplete. Projections made based on the proportions between semesters of the previous year at the departmental/national level and by type of property.

Evolution of the number of transactions - 35 - Noyal-sur-Vilaine

Yearly data

Descending order
Year
Houses
house
transactions
Houses
house
Price per m²
Apartments
apt.
transactions
Apartments
apt.
Price per m²
2025
15
2 818 
11
3 047 
2024
46
2 818 
30
2 898 
2023
35
2 697 
31
2 941 
2022
65
2 917 
42
2 943 
2021
58
2 726 
36
2 792 
2020
42
2 505 
20
2 311 
2019
35
2 504 
17
2 339 
2018
31
2 260 
22
2 154 
2017
51
2 231 
15
1 970 
2016
32
2 132 
18
2 171 
2015
39
2 134 
16
2 170 
2014
39
1 971 
17
2 174 

Analysis

Structure of prices per m²

Values of price percentiles per m² over the periods used for the estimated price of each type of property.

Structure of transaction amounts

Values of transaction amounts percentiles over the periods used for the estimated price of each type of property.

Transaction amounts and prices per m² by percentile

Ascending order
Percentile
Houses
house
Price per m²
Houses
house
Transaction amount
Apartments
apt.
Price per m²
Apartments
apt.
Transaction amount
10th percentile
2 366 
195 K
2 573 
113 K
20th percentile
2 603 
236 K
2 727 
126 K
30th percentile
2 658 
278 K
2 842 
131 K
40th percentile
2 784 
300 K
2 934 
135 K
50th percentile
2 844 
316 K
3 024 
140 K
60th percentile
2 979 
340 K
3 126 
148 K
70th percentile
3 076 
373 K
3 268 
164 K
80th percentile
3 311 
410 K
3 356 
186 K
90th percentile
3 568 
445 K
3 538 
213 K

National and departmental comparison

Evolution of the median price per m² of houses

Evolution of the median price per m² of apartments

Quarterly evolution

Evolution of the median price per m²

Evolution of the number of transactions

Quarterly data

Descending order
Quarter
Houses
house
transactions
Houses
house
Price per m²
Apartments
apt.
transactions
Apartments
apt.
Price per m²
2025 Q2
6
3 077 
4
3 605 
2025 Q1
9
2 784 
7
3 000 
2024 Q4
4
2 625 
6
3 202 
2024 Q3
15
2 906 
11
2 936 
2024 Q2
16
2 830 
6
2 797 
2024 Q1
11
2 467 
7
2 714 
2023 Q4
6
2 308 
10
2 634 
2023 Q3
9
2 622 
10
2 882 
2023 Q2
12
2 771 
7
3 019 
2023 Q1
8
2 872 
4
3 026 
2022 Q4
13
3 125 
9
3 182 
2022 Q3
26
2 920 
12
2 820 
2022 Q2
14
2 806 
16
2 943 
2022 Q1
12
2 684 
5
2 791 
2021 Q4
9
2 897 
10
3 133 
2021 Q3
21
2 765 
12
2 897 
2021 Q2
15
2 662 
9
2 420 
2021 Q1
13
2 545 
5
2 698 
2020 Q4
15
2 559 
2
2 221 
2020 Q3
10
2 313 
6
2 444 
2020 Q2
11
2 319 
7
2 306 
2020 Q1
6
2 644 
5
2 000 
2019 Q4
12
2 790 
7
2 540 
2019 Q3
16
2 624 
3
2 417 
2019 Q2
1
2 019 
4
2 198 
2019 Q1
6
2 265 
3
2 280 
2018 Q4
6
2 152 
4
2 330 
2018 Q3
9
2 360 
6
2 062 
2018 Q2
7
2 404 
3
1 825 
2018 Q1
9
2 062 
9
2 232 
2017 Q4
13
2 414 
5
1 750 
2017 Q3
16
2 364 
2
2 364 
2017 Q2
11
1 829 
6
2 134 
2017 Q1
11
2 095 
2
1 874 
2016 Q4
7
2 374 
7
2 407 
2016 Q3
13
2 129 
3
2 088 
2016 Q2
5
1 696 
3
2 282 
2016 Q1
7
2 368 
5
1 667 
2015 Q4
11
2 148 
6
1 852 
2015 Q3
9
2 180 
4
1 694 
2015 Q2
12
2 148 
3
2 348 
2015 Q1
7
1 971 
3
2 247 
2014 Q4
8
1 980 
7
2 156 
2014 Q3
11
2 237 
3
1 667 
2014 Q2
8
1 938 
1
2 438 
2014 Q1
12
1 848 
6
2 190 

Overview of the latest real estate transactions

The following list is an anonymized overview of the latest transactions. For more details and to find all transactions, please use the map to view transactions by plot or the transaction search page for a search by criteria.

2025-06-30
95 000 
1 979  /m²(48 m²)
Sale
Commercial property
48 m2
2025-06-20
315 000 
2 351  /m²(134 m²)
Sale
Houses
House
4 rooms
134 m2
Land
491 m2
-Sols
2025-06-16
511 990 
5 224  /m²(98 m²)
6 169  /m²(83 m²)
Sale
Houses
House
3 rooms
83 m2
Commercial property
15 m2
Land
2000 m2
-Terrains d'agrément
Land
1000 m2
-Sols
Land
1130 m2
-Prés
Land
441 m2
-Prés
2025-06-16
289 408 
3 911  /m²(74 m²)
Sale
Apartments
Apartment
3 rooms
74 m2
2 outbuildings
2025-06-03
195 000 
2 786  /m²(70 m²)
Sale
Houses
House
4 rooms
70 m2
Land
342 m2
-Sols
2025-05-27
29 500 
Sale
1 outbuilding
2025-05-27
29 500 
Sale
1 outbuilding
2025-05-23
129 000 
3 686  /m²(35 m²)
Sale
1 outbuilding
Apartments
Apartment
2 rooms
35 m2
1 outbuilding
2025-05-12
289 000 
3 524  /m²(82 m²)
Sale
Apartments
Apartment
3 rooms
82 m2
2 outbuildings
2025-05-12
300 000 
3 000  /m²(100 m²)
Sale
Houses
House
5 rooms
100 m2
Land
522 m2
-Sols
2025-05-12
195 000 
3 421  /m²(57 m²)
Sale
Houses
House
3 rooms
57 m2
Land
448 m2
-Sols
2025-05-07
300 000 
3 571  /m²(84 m²)
Sale
Land
237 m2
-Terrains d'agrément
Houses
House
5 rooms
84 m2
1 outbuilding
Land
938 m2
-Terrains d'agrément
Land
500 m2
-Sols
Land
59 m2
-Terrains d'agrément
Land
13 m2
-Terrains d'agrément
2025-05-02
410 000 
3 154  /m²(130 m²)
Sale
Houses
House
5 rooms
130 m2
Land
583 m2
-Sols
2025-04-30
90 000 
1 765  /m²(51 m²)
Sale
Apartments
Apartment
2 rooms
51 m2
1 outbuilding
2025-04-22
370 000 
389  /m²(951 m²)
Sale
Commercial property
951 m2
Land
3309 m2
-Sols
2025-03-28
76 000 
2 923  /m²(26 m²)
Sale
Apartments
Apartment
1 room
26 m2
1 outbuilding
2025-03-27
180 000 
1 731  /m²(104 m²)
Sale
Houses
House
5 rooms
104 m2
Land
307 m2
-Sols
2025-03-18
5 600 
Sale
Land
8280 m2
-Terres
2025-03-18
27 300 
Sale
Land
23 m2
-Prés
Land
1270 m2
-Terres
Land
7690 m2
-Terres
Land
4931 m2
-Prés
Land
1350 m2
-Prés
Land
13180 m2
-Terres
Land
8080 m2
-Terres
Land
2910 m2
-Terres
Land
2660 m2
-Prés
2025-03-18
202 000 
2 557  /m²(79 m²)
Sale
Houses
House
3 rooms
79 m2
Land
629 m2
-Sols
1434 transactions listed in the municipality

Ille-et-Vilaine (35)

Most expensive cities

City
name
Descending orderHouses
house
Price per m²
5 682 
5 538 
4 545 
4 504 
4 150 
4 118 
3 857 
3 721 
3 714 
City
name
Descending orderApartments
apt.
Price per m²
5 306 
5 061 
4 627 
4 194 
4 011 
3 914 
3 835 
3 755 

Least expensive cities

City
name
Ascending orderHouses
house
Price per m²
982 
1 041 
1 047 
1 111 
1 125 
1 128 
1 150 
City
name
Ascending orderApartments
apt.
Price per m²
238 
267 
315 
352