emooki
HomePrice mapTransactions
🇬🇧 English🇫🇷 Français🇩🇪 Deutsch🇪🇸 Español🇮🇹 Italiano

Real estate price map


Real estate price map in the municipality of Guipry-Messac, choose a section to see transactions by parcel.

Ille-et-Vilaine (35)

Guipry-Messac - Real estate price m²

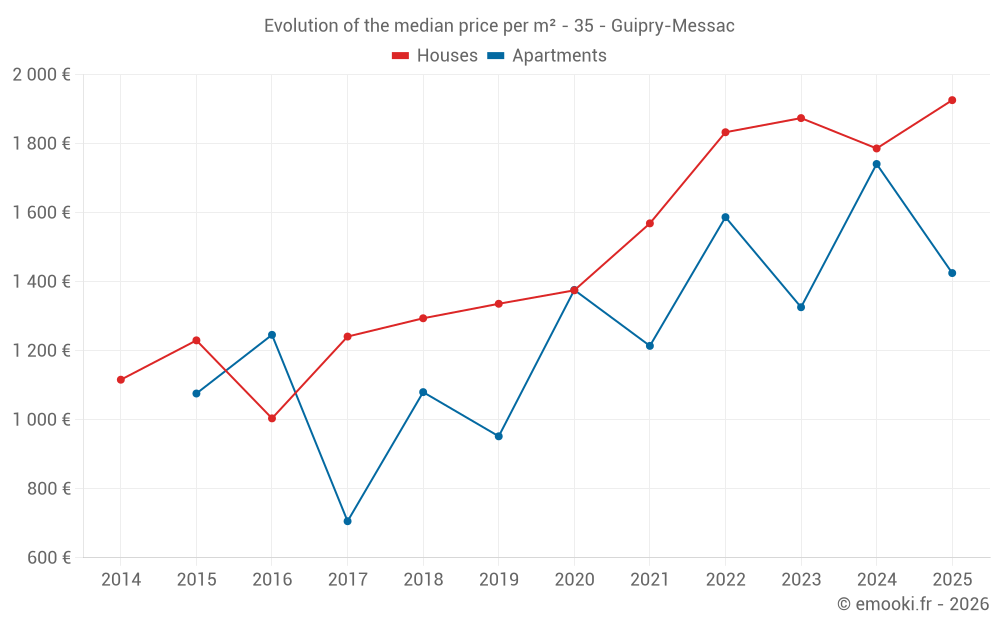
Median price of real estate
in the municipality of Guipry-Messac

HousesHouses
1 926  /m²
1-23-45-67-89-10
Reliability 9/10
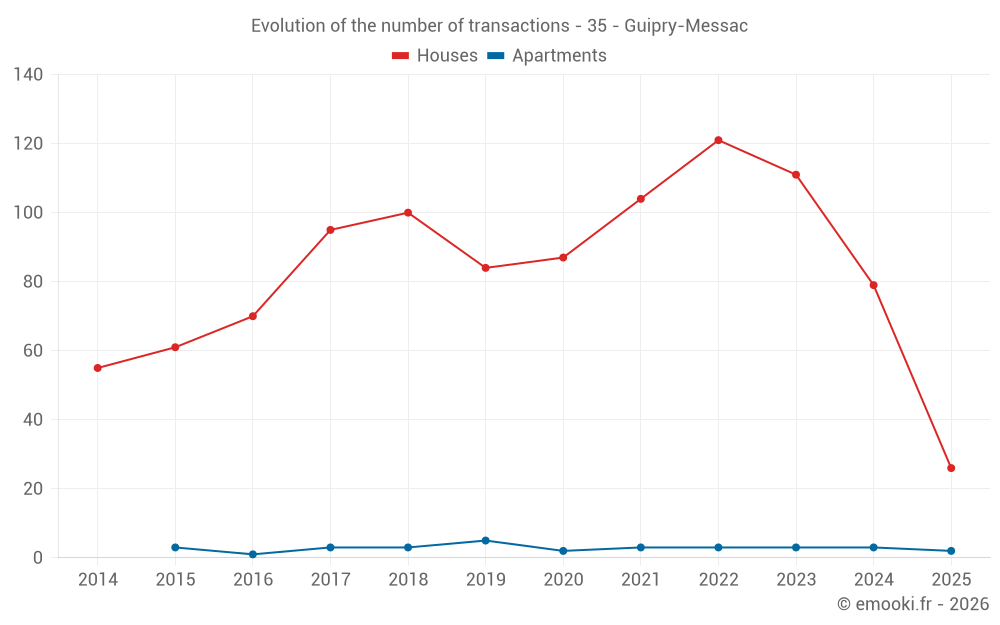
Median price on the 26 transactions of the last 6 months.
from 1 328 to
2 208  /m²
60% of transactions from the 2nd to the 8th deciles.
ApartmentsApartments
1 698  /m²
1-23-45-67-89-10
Reliability 5/10
Median price on the 13 transactions of the last 48 months.
from 1 295 to
2 094  /m²
60% of transactions from the 2nd to the 8th deciles.
DwellingsDwellings
1 926  /m²
1-23-45-67-89-10
Reliability 9/10
Median price on the 28 transactions of the last 6 months.
from 1 237 to
2 215  /m²
60% of transactions from the 2nd to the 8th deciles.
HousesEvolution of the price per m² of houses since...
1 year
+7.8%
2 years
+2.8%
3 years
+5.1%
4 years
+23%
5 years
+40%
6 years
+44%
7 years
+49%
8 years
+55%
9 years
+92%
10 years
+57%
11 years
+73%

Yearly evolution

Evolution of the median price per m²

Evolution of the median price per m² - 35 - Guipry-Messac

Evolution of the number of transactions

Warning, last year incomplete. Projections made based on the proportions between semesters of the previous year at the departmental/national level and by type of property.

Evolution of the number of transactions - 35 - Guipry-Messac

Yearly data

Descending order
Year
Houses
house
transactions
Houses
house
Price per m²
Apartments
apt.
transactions
Apartments
apt.
Price per m²
2025
26
1 926 
2
1 425 
2024
79
1 786 
3
1 741 
2023
111
1 874 
3
1 326 
2022
121
1 833 
3
1 587 
2021
104
1 569 
3
1 214 
2020
87
1 375 
2
1 376 
2019
84
1 336 
5
952 
2018
100
1 294 
3
1 080 
2017
95
1 241 
3
706 
2016
70
1 004 
1
1 246 
2015
61
1 230 
3
1 076 
2014
55
1 116 
0
--- 

Analysis

Structure of prices per m²

Values of price percentiles per m² over the periods used for the estimated price of each type of property.

Structure of transaction amounts

Values of transaction amounts percentiles over the periods used for the estimated price of each type of property.

Transaction amounts and prices per m² by percentile

Ascending order
Percentile
Houses
house
Price per m²
Houses
house
Transaction amount
Apartments
apt.
Price per m²
Apartments
apt.
Transaction amount
10th percentile
944 
60 000 
1 226 
98 150 
20th percentile
1 328 
114 K
1 295 
99 970 
30th percentile
1 664 
128 K
1 465 
104 K
40th percentile
1 917 
138 K
1 581 
120 K
50th percentile
1 926 
169 K
1 698 
126 K
60th percentile
2 000 
190 K
1 764 
139 K
70th percentile
2 160 
213 K
1 946 
146 K
80th percentile
2 208 
223 K
2 094 
150 K
90th percentile
2 385 
250 K
2 196 
198 K

National and departmental comparison

Evolution of the median price per m² of houses

Evolution of the median price per m² of apartments

Quarterly evolution

Evolution of the median price per m²

Evolution of the number of transactions

Quarterly data

Descending order
Quarter
Houses
house
transactions
Houses
house
Price per m²
Apartments
apt.
transactions
Apartments
apt.
Price per m²
2025 Q2
8
1 966 
0
--- 
2025 Q1
18
1 918 
2
1 425 
2024 Q4
24
1 978 
0
--- 
2024 Q3
20
1 792 
2
1 776 
2024 Q2
24
1 784 
1
1 741 
2024 Q1
11
1 779 
0
--- 
2023 Q4
32
1 791 
0
--- 
2023 Q3
34
1 860 
1
2 101 
2023 Q2
29
1 882 
0
--- 
2023 Q1
16
2 071 
2
1 300 
2022 Q4
33
1 886 
1
2 083 
2022 Q3
43
1 763 
0
--- 
2022 Q2
21
1 844 
2
1 572 
2022 Q1
24
1 776 
0
--- 
2021 Q4
25
1 626 
2
2 034 
2021 Q3
40
1 640 
0
--- 
2021 Q2
18
1 907 
0
--- 
2021 Q1
21
1 476 
1
431 
2020 Q4
29
1 525 
1
1 670 
2020 Q3
23
1 260 
1
1 081 
2020 Q2
19
1 454 
0
--- 
2020 Q1
16
1 392 
0
--- 
2019 Q4
24
1 313 
1
1 377 
2019 Q3
22
1 567 
1
1 136 
2019 Q2
17
1 176 
1
952 
2019 Q1
21
1 158 
2
900 
2018 Q4
24
1 314 
0
--- 
2018 Q3
31
1 406 
2
1 008 
2018 Q2
23
1 198 
0
--- 
2018 Q1
22
1 178 
1
1 091 
2017 Q4
31
971 
0
--- 
2017 Q3
25
1 258 
0
--- 
2017 Q2
25
1 493 
2
690 
2017 Q1
14
1 412 
1
706 
2016 Q4
26
1 043 
0
--- 
2016 Q3
19
877 
0
--- 
2016 Q2
11
1 018 
1
1 246 
2016 Q1
14
1 014 
0
--- 
2015 Q4
14
1 417 
1
1 108 
2015 Q3
18
1 082 
0
--- 
2015 Q2
19
1 030 
2
642 
2015 Q1
10
1 302 
0
--- 
2014 Q4
13
1 109 
0
--- 
2014 Q3
18
1 262 
0
--- 
2014 Q2
14
1 118 
0
--- 
2014 Q1
10
1 050 
0
--- 

Overview of the latest real estate transactions

The following list is an anonymized overview of the latest transactions. For more details and to find all transactions, please use the map to view transactions by plot or the transaction search page for a search by criteria.

2025-06-25
4 116 
Sale
Land
10290 m2
-Futaies résineuses
2025-06-25
2 848 
Sale
Land
11390 m2
-Futaies résineuses
2025-06-25
3 045 
Sale
Land
12180 m2
-Landes
2025-06-25
1 396 
Sale
Land
5170 m2
-Prés
2025-06-25
1 412 
Sale
Land
3070 m2
-Landes
2025-06-25
3 709 
Sale
Land
9760 m2
-Landes
2025-06-25
2 067 
Sale
Land
6890 m2
-Futaies résineuses
2025-06-20
23 000 
Sale
Land
12 m2
-Sols
1 outbuilding
Land
26 m2
-Sols
2025-06-20
138 000 
2 000  /m²(69 m²)
Sale
Houses
House
3 rooms
69 m2
Land
470 m2
-Sols
2025-06-18
1 400 
Sale
Land
280 m2
-Terres
2025-06-18
2 219 
Sale
Land
6340 m2
-Terres
2025-06-18
33 346 
Sale
Land
3 m2
-Terrains à bâtir
Land
375 m2
-Terrains à bâtir
Land
457 m2
-Terrains à bâtir
Land
317 m2
-Terrains à bâtir
Land
317 m2
-Terrains à bâtir
Land
316 m2
-Terrains à bâtir
Land
318 m2
-Terrains à bâtir
Land
582 m2
-Terrains à bâtir
Land
1059 m2
-Terrains d'agrément
Land
680 m2
-Sols
Land
16 m2
-Terrains d'agrément
Land
3 m2
-Sols
Land
9 m2
-Terrains à bâtir
Land
43 m2
-Terrains d'agrément
Land
10 m2
-Sols
Land
9 m2
-Sols
2025-06-17
58 713 
Sale
Land
388 m2
-Terrains à bâtir
Land
332 m2
-Terrains à bâtir
Land
280 m2
-Terrains à bâtir
Land
280 m2
-Terrains à bâtir
Land
278 m2
-Terrains à bâtir
Land
278 m2
-Terrains à bâtir
Land
278 m2
-Terrains à bâtir
Land
398 m2
-Terrains à bâtir
Land
456 m2
-Terrains à bâtir
Land
338 m2
-Terrains à bâtir
Land
329 m2
-Terrains à bâtir
Land
386 m2
-Terrains à bâtir
Land
1668 m2
-Terrains à bâtir
Land
414 m2
-Terrains à bâtir
Land
1196 m2
-Sols
Land
249 m2
-Terrains d'agrément
Land
31 m2
-Terrains d'agrément
Land
17 m2
-Terrains d'agrément
Land
6 m2
-Terrains d'agrément
Land
159 m2
-Terrains d'agrément
Land
21 m2
-Terrains d'agrément
Land
4 m2
-Sols
Land
1 m2
-Sols
Land
160 m2
-Sols
Land
1 m2
-Sols
2025-06-17
8 389 
Sale
Land
148 m2
-Sols
Land
21 m2
-Sols
Land
872 m2
-Sols
Land
63 m2
-Sols
Land
1 m2
-Sols
2025-06-13
223 270 
2 147  /m²(104 m²)
Sale
Houses
House
5 rooms
104 m2
Land
1257 m2
-Sols
2025-06-13
5 310 
Sale
Land
3455 m2
-Terres
2025-06-13
275 000 
1 528  /m²(180 m²)
Sale
Houses
House
7 rooms
180 m2
Land
901 m2
-Sols
2025-06-13
22 795 
Sale
Land
1583 m2
-Chemin de fer
2025-06-06
259 000 
570  /m²(454 m²)
1 682  /m²(154 m²)
Sale
Apartments
Apartment
3 rooms
75 m2
Apartments
Apartment
3 rooms
79 m2
Commercial property
300 m2
Land
276 m2
-Sols
Land
528 m2
-Jardins
/Jardin potager
Land
885 m2
-Sols
2025-06-03
8 423 
Sale
Land
4629 m2
-Terres
Land
7600 m2
-Terres
Land
870 m2
-Sols
Land
2244 m2
-Sols
Land
8000 m2
-Terres
1971 transactions listed in the municipality

Ille-et-Vilaine (35)

Most expensive cities

City
name
Descending orderHouses
house
Price per m²
5 682 
5 538 
4 545 
4 504 
4 150 
4 118 
3 857 
3 721 
3 714 
City
name
Descending orderApartments
apt.
Price per m²
5 306 
5 061 
4 627 
4 194 
4 011 
3 914 
3 835 
3 755 

Least expensive cities

City
name
Ascending orderHouses
house
Price per m²
982 
1 041 
1 047 
1 111 
1 125 
1 128 
1 150 
City
name
Ascending orderApartments
apt.
Price per m²
238 
267 
315 
352