emooki
HomePrice mapTransactions
🇬🇧 English🇫🇷 Français🇩🇪 Deutsch🇪🇸 Español🇮🇹 Italiano

Real estate price map


Real estate price map in the municipality of Bazouges-la-Pérouse, choose a section to see transactions by parcel.

Ille-et-Vilaine (35)
Bazouges-la-Pérouse

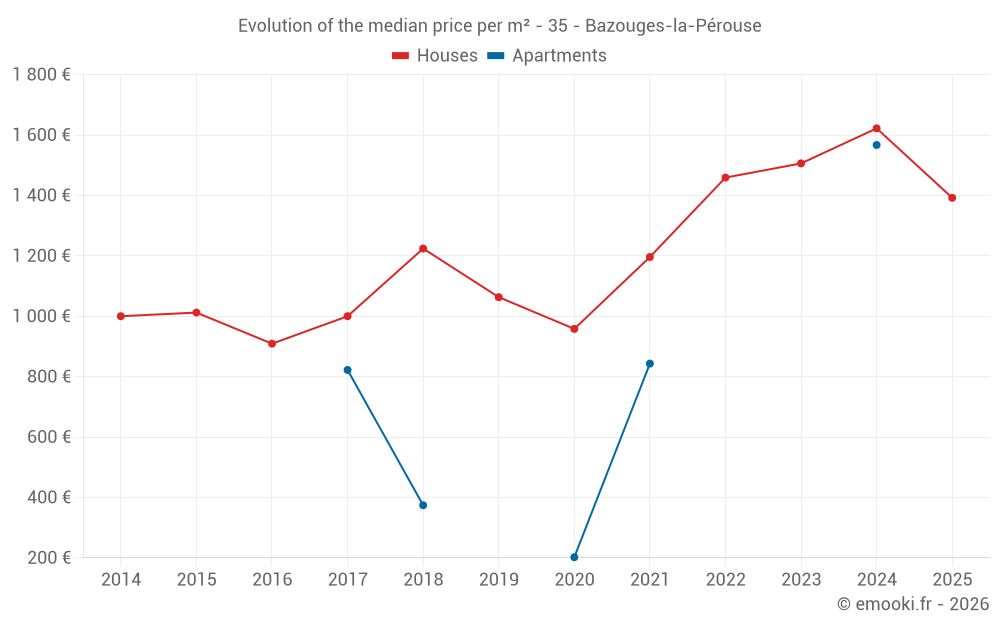
Median price of real estate
in the municipality of Bazouges-la-Pérouse

HousesHouses
1 328  /m²
1-23-45-67-89-10
Reliability 8/10
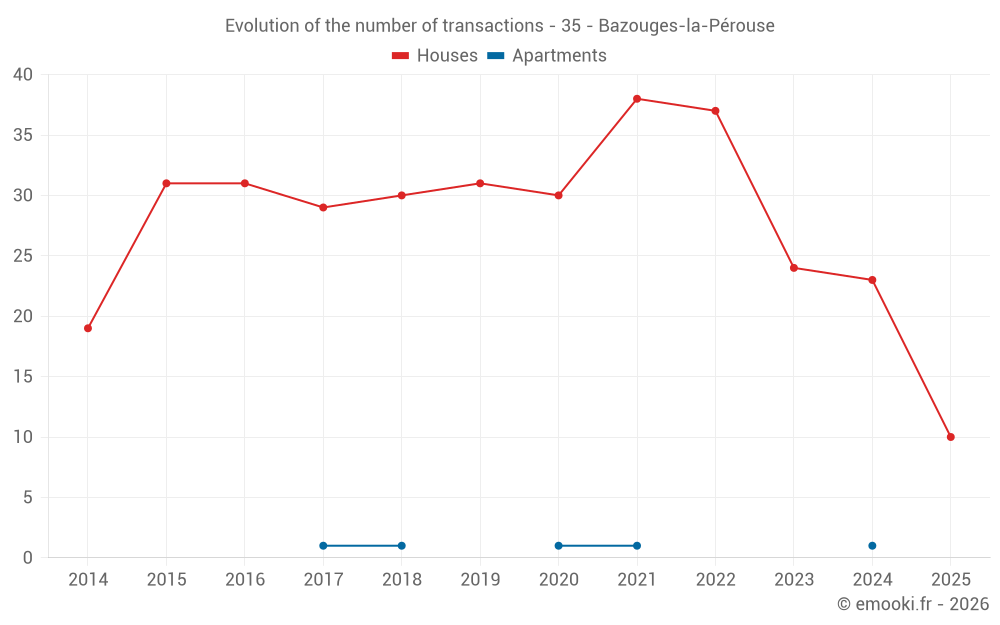
Median price on the 20 transactions of the last 12 months.
from 924 to
1 960  /m²
60% of transactions from the 2nd to the 8th deciles.
ApartmentsApartments
822  /m²
1-23-45-67-89-10
Reliability 2/10
Median price on the 5 transactions of the last 96 months.
DwellingsDwellings
1 333  /m²
1-23-45-67-89-10
Reliability 8/10
Median price on the 21 transactions of the last 12 months.
from 933 to
1 950  /m²
60% of transactions from the 2nd to the 8th deciles.
HousesEvolution of the price per m² of houses since...
1 year
-14%
2 years
-7.6%
3 years
-4.6%
4 years
+16%
5 years
+45%
6 years
+31%
7 years
+14%
8 years
+39%
9 years
+53%
10 years
+38%
11 years
+39%
The price per m² of houses has decreased by 14% since 1 year, but it has increased by 53% in 9 years.

Yearly evolution

Evolution of the median price per m²

Evolution of the number of transactions

Warning, last year incomplete. Projections made based on the proportions between semesters of the previous year at the departmental/national level and by type of property.

Yearly data

Descending order
Year
Houses
house
transactions
Houses
house
Price per m²
Apartments
apt.
transactions
Apartments
apt.
Price per m²
2025
10
1 392 
0
--- 
2024
23
1 622 
1
1 567 
2023
24
1 506 
0
--- 
2022
37
1 459 
0
--- 
2021
38
1 196 
1
843 
2020
30
958 
1
202 
2019
31
1 063 
0
--- 
2018
30
1 224 
1
374 
2017
29
1 000 
1
822 
2016
31
909 
0
--- 
2015
31
1 012 
0
--- 
2014
19
1 000 
0
--- 

Analysis

Structure of prices per m²

Values of price percentiles per m² over the periods used for the estimated price of each type of property.

Structure of transaction amounts

Values of transaction amounts percentiles over the periods used for the estimated price of each type of property.

Transaction amounts and prices per m² by percentile

Ascending order
Percentile
Houses
house
Price per m²
Houses
house
Transaction amount
Apartments
apt.
Price per m²
Apartments
apt.
Transaction amount
10th percentile
600 
52 400 
271 
29 860 
20th percentile
924 
73 480 
340 
34 620 
30th percentile
1 157 
89 424 
464 
45 600 
40th percentile
1 312 
114 K
643 
62 800 
50th percentile
1 328 
120 K
822 
80 000 
60th percentile
1 525 
128 K
830 
93 836 
70th percentile
1 752 
148 K
839 
108 K
80th percentile
1 960 
178 K
988 
160 K
90th percentile
2 264 
211 K
1 277 
250 K

National and departmental comparison

Evolution of the median price per m² of houses

Evolution of the median price per m² of apartments

Quarterly evolution

Evolution of the median price per m²

Evolution of the number of transactions

Quarterly data

Descending order
Quarter
Houses
house
transactions
Houses
house
Price per m²
Apartments
apt.
transactions
Apartments
apt.
Price per m²
2025 Q2
3
1 950 
0
--- 
2025 Q1
7
1 323 
0
--- 
2024 Q4
5
1 318 
1
1 567 
2024 Q3
5
1 750 
0
--- 
2024 Q2
7
1 769 
0
--- 
2024 Q1
6
1 700 
0
--- 
2023 Q4
7
1 873 
0
--- 
2023 Q3
8
1 258 
0
--- 
2023 Q2
4
2 594 
0
--- 
2023 Q1
5
1 264 
0
--- 
2022 Q4
6
1 554 
0
--- 
2022 Q3
7
1 964 
0
--- 
2022 Q2
12
1 219 
0
--- 
2022 Q1
12
1 690 
0
--- 
2021 Q4
10
1 370 
0
--- 
2021 Q3
8
1 110 
1
843 
2021 Q2
9
840 
0
--- 
2021 Q1
11
1 333 
0
--- 
2020 Q4
9
982 
0
--- 
2020 Q3
8
860 
1
202 
2020 Q2
4
960 
0
--- 
2020 Q1
9
1 143 
0
--- 
2019 Q4
8
1 257 
0
--- 
2019 Q3
10
828 
0
--- 
2019 Q2
3
685 
0
--- 
2019 Q1
10
1 070 
0
--- 
2018 Q4
13
1 212 
0
--- 
2018 Q3
8
1 182 
1
374 
2018 Q2
6
1 371 
0
--- 
2018 Q1
3
1 235 
0
--- 
2017 Q4
12
1 042 
1
822 
2017 Q3
9
1 020 
0
--- 
2017 Q2
4
1 544 
0
--- 
2017 Q1
4
590 
0
--- 
2016 Q4
9
875 
0
--- 
2016 Q3
8
1 086 
0
--- 
2016 Q2
7
763 
0
--- 
2016 Q1
7
909 
0
--- 
2015 Q4
5
1 214 
0
--- 
2015 Q3
12
1 002 
0
--- 
2015 Q2
6
1 198 
0
--- 
2015 Q1
8
731 
0
--- 
2014 Q4
3
1 176 
0
--- 
2014 Q3
3
1 455 
0
--- 
2014 Q2
11
900 
0
--- 
2014 Q1
2
544 
0
--- 

Overview of the latest real estate transactions

The following list is an anonymized overview of the latest transactions. For more details and to find all transactions, please use the map to view transactions by plot or the transaction search page for a search by criteria.

2025-06-05
29 000 
630  /m²(46 m²)
Sale
Houses
House
1 room
46 m2
Land
243 m2
-Sols
2025-05-30
5 000 
Sale
Land
8330 m2
-Peupleraies
Land
1080 m2
-Prés
2025-05-23
62 250 
Sale
Land
18440 m2
-Prés
Land
13565 m2
-Terres
Land
2435 m2
-Prés
Land
13800 m2
-Prés
Land
4620 m2
-Terres
Land
4090 m2
-Prés
Land
11495 m2
-Terres
Land
10500 m2
-Terres
Land
5955 m2
-Terres
Land
11390 m2
-Terres
Land
14060 m2
-Terres
Land
6270 m2
-Terres
Land
3100 m2
-Terres
2025-05-23
305 000 
3 081  /m²(99 m²)
Sale
Houses
House
4 rooms
99 m2
Land
550 m2
-Sols
Land
833 m2
-Terres
Land
7 m2
-Sols
Land
136 m2
-Terrains d'agrément
Land
574 m2
-Terrains d'agrément
Land
1924 m2
-Terres
1 outbuilding
Land
35 m2
-Sols
2025-05-05
117 000 
1 950  /m²(60 m²)
Sale
Land
655 m2
-Jardins
/Jardin potager
Houses
House
2 rooms
60 m2
1 outbuilding
Land
115 m2
-Sols
2025-03-25
30 000 
Sale
Land
47350 m2
-Terres
Land
24820 m2
-Terres
Land
8485 m2
-Terres
Land
11275 m2
-Terres
Land
1611 m2
-Prés
Land
5234 m2
-Prés
2025-03-18
91 320 
1 323  /m²(69 m²)
Sale
Houses
House
3 rooms
69 m2
Land
1470 m2
-Sols
Land
860 m2
-Sols
Land
655 m2
-Jardins
/Jardin potager
Land
1180 m2
-Vergers
/CIDRE
Land
40 m2
-Landes
2025-03-13
480 000 
Sale
Land
1187 m2
-Sols
2025-02-25
1 771 
74  /m²(24 m²)
Sale
Houses
House
1 room
24 m2
Land
4450 m2
-Taillis simples
Land
750 m2
-Eaux
Land
50 m2
-Sols
2025-02-11
140 000 
933  /m²(150 m²)
Sale
Houses
House
4 rooms
150 m2
Land
55 m2
-Sols
Land
1165 m2
-Terres
Land
93 m2
-Sols
2025-02-03
165 000 
1 460  /m²(113 m²)
Sale
Houses
House
6 rooms
113 m2
2 outbuildings
Land
310 m2
-Sols
2025-02-03
17 000 
Sale
Land
292 m2
-Prés
Land
365 m2
-Prés
Land
485 m2
-Jardins
/Jardin potager
Land
3435 m2
-Peupleraies
Land
2500 m2
-Peupleraies
Land
3505 m2
-Peupleraies
Land
1400 m2
-Peupleraies
2025-01-31
110 000 
2 000  /m²(55 m²)
Sale
Houses
House
3 rooms
55 m2
1 outbuilding
Land
810 m2
-Sols
Land
60 m2
-Sols
2025-01-24
75 600 
1 758  /m²(43 m²)
Sale
2 outbuildings
Land
176 m2
-Sols
Houses
House
2 rooms
43 m2
1 outbuilding
Land
142 m2
-Sols
2025-01-21
4 600 
Sale
Land
3680 m2
-Taillis simples
2025-01-10
55 000 
887  /m²(62 m²)
Sale
Houses
House
3 rooms
62 m2
Land
360 m2
-Sols
Land
528 m2
-Prés
Land
28 m2
-Terres
Land
2 m2
-Terres
2024-12-26
120 000 
1 622  /m²(74 m²)
Sale
Land
144 m2
-Sols
Land
5086 m2
-Terres
Land
340 m2
-Jardins
/Jardin potager
Land
2085 m2
-Vergers
/CIDRE
Houses
House
5 rooms
74 m2
Land
104 m2
-Sols
Land
11516 m2
-Prés
1 outbuilding
Land
1465 m2
-Sols
2024-12-23
6 000 
Sale
Land
4040 m2
-Prés
2024-12-18
24 000 
Sale
Land
36 m2
-Sols
Land
698 m2
-Jardins
/Jardin potager
2024-12-18
2 500 
Sale
Land
3280 m2
-Prés
Land
1310 m2
-Taillis simples
703 transactions listed in the municipality

Ille-et-Vilaine (35)

Most expensive cities

City
name
Descending orderHouses
house
Price per m²
5 682 
5 538 
4 545 
4 504 
4 150 
4 118 
3 857 
3 721 
3 714 
City
name
Descending orderApartments
apt.
Price per m²
5 306 
5 061 
4 627 
4 194 
4 011 
3 914 
3 835 
3 755 

Least expensive cities

City
name
Ascending orderHouses
house
Price per m²
982 
1 041 
1 047 
1 111 
1 125 
1 128 
1 150 
City
name
Ascending orderApartments
apt.
Price per m²
238 
267 
315 
352